These 3rd grade statistics printable worksheets resources put the full arc of the data unit in one place — tally charts, scaled picture graphs, scaled bar graphs, and the comparison questions that ask students to do real mathematical thinking with data they have organized themselves. Grade 3 is the first year students work with graph scales greater than one, and that single shift is responsible for most of the errors teachers see during this unit. Each worksheet stays focused enough that students spend their cognitive energy on the math, not on decoding the task.
The Specific Skills Each Worksheet Builds
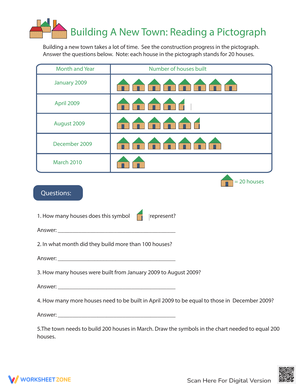
The set moves through the Grade 3 data progression in deliberate steps. Students begin by recording raw survey results into tally charts and frequency tables — work that builds the habit of organized counting before any visual display appears. From there, each worksheet moves into reading and creating picture graphs, where the key is central because each symbol may represent two, five, or ten items. Bar graph worksheets ask students to read labeled axes, interpret unmarked intervals, and pull answers from bars that do not always land on a gridline.
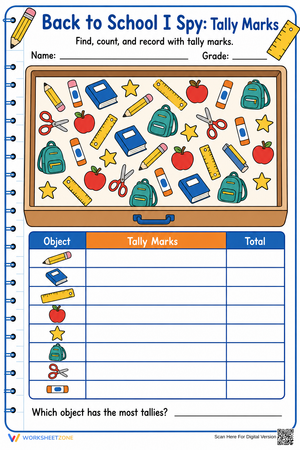
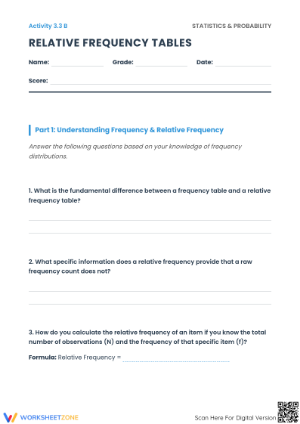
- Tally charts and frequency tables: Sorting and recording data before any graphing begins.
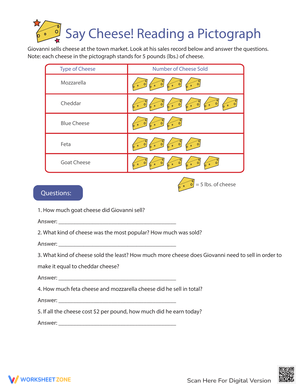
- Scaled picture graphs: Using the key to convert symbol counts into actual quantities.
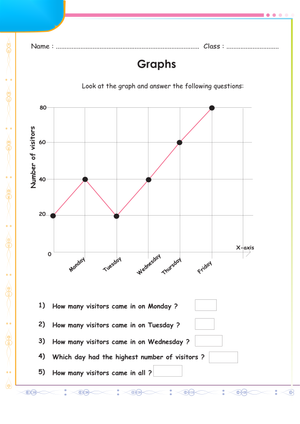
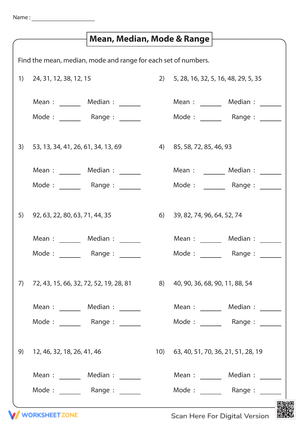
- Scaled bar graphs: Reading axes, estimating between gridlines, and determining category totals.
- Comparison questions: Solving "how many more" and "how many fewer" problems using the data provided.
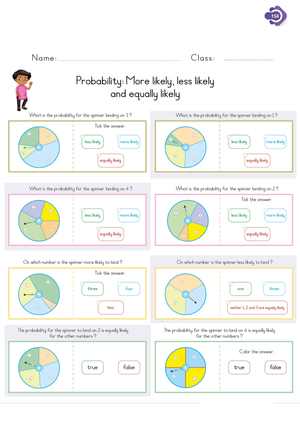
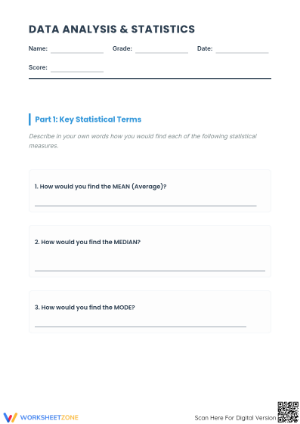
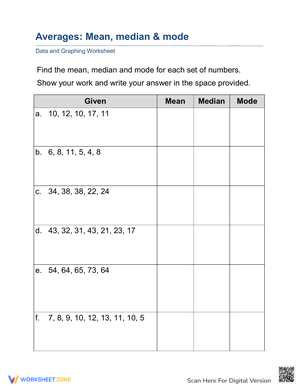
- Written interpretation: Explaining what the graph shows in a complete sentence, with numbers as evidence.
Topics across the set draw on familiar school and classroom contexts — favorite lunch items, books read per week, weather observations, classroom pet preferences — so students can direct their attention toward statistical thinking rather than parsing an unfamiliar scenario.
Student Errors Worth Anticipating Before You Hand These Out
The most persistent error in Grade 3 data work is not faulty arithmetic — it is scale misreading. On a bar graph where the axis counts by fives, a student will often read the bar stopping at 15 correctly, then record 3 for a bar stopping at 30 because they counted bar segments rather than reading labeled values. That error looks like carelessness but reveals a conceptual gap: the student is treating each interval as a unit count. An instructional move that reliably helps is asking students to mark the value halfway between two labeled gridlines before answering any questions at all — forcing them to confirm that the midpoint between 10 and 20 is 15, not 1.5. That ten-second check slows the segment-counting habit before it produces a wrong answer.
Picture graph work surfaces a related but distinct problem. A student who counts six symbols and records 6 has ignored the key entirely, applying the mental model from first-grade graphs where each picture equaled exactly one item. Worth watching in actual student work: students who get the right answer on the first pictograph — key says each symbol equals 2 — but revert to unit-counting when the key switches to 5 on a later worksheet. That inconsistency shows the rule has not yet generalized. On comparison questions, subtraction direction is a third trouble spot: students who correctly read 20 and 35 for two categories will sometimes set up 20 minus 35 and then freeze. Asking those students to circle the larger value before writing any equation clears the error quickly and transfers into a class-wide habit that holds up on assessments.
Building These Worksheets Into the Teaching Week
The most efficient use of these resources is to sequence them around a single class data set. Collect a quick survey on Monday — how many siblings students have, or their favorite recess activity — and use that real information as the basis for four or five worksheets across the week. Students sort responses into a tally chart on day one, transfer the tally into a frequency table and picture graph on day two, and work with bar graph format on day three. By the time they reach the comparison and interpretation questions, they already know the data from memory, so all their effort goes toward graph-reading skills rather than making sense of the context.
For the last eight minutes before a transition to specials or lunch, a quick exit worksheet — one small bar graph with two questions — gives useful real-time feedback on whether students can identify the largest category and calculate a difference. That information is actionable the same afternoon. When selecting which 3rd grade statistics printable worksheets resources to pull for small-group reteach, target one error type per session rather than re-teaching the whole unit. Give the scale-misreading group a set focused on bar graphs with axes counted by twos and fives before mixing in pictographs; the scale-reading habit needs to be solid before the additional pictograph key step gets layered on top.
Standard Alignment
The primary standard addressed throughout this set is CCSS 3.MD.B.3: "Draw a scaled picture graph and a scaled bar graph to represent a data set with several categories. Solve one- and two-step 'how many more' and 'how many fewer' problems using information presented in scaled bar graphs." In classroom terms, this standard sits in the middle of the Grade 3 year, after students have solidified addition and subtraction strategies and can apply them inside a data context. The 3rd grade statistics printable worksheets set keeps scaled axes, symbol keys, and comparison subtraction as the consistent instructional target while rotating contexts, so students learn to transfer the skill rather than memorize specific displays. Several tally and table worksheets in the set also support 3.MD.B.4 through data collection and organized recording tasks.
Adjusting the Work for Students at Different Points in the Unit
Students who enter the unit with weak number-line understanding need additional support on scale reading before they can work independently with bar graphs. For those students, begin with tally chart and table worksheets where quantities are counted directly. Keep category totals below twenty, use intervals of two, and limit questions to single-step reading tasks. The goal at this level is that students can move information reliably between two formats before the interpretive demands increase.
On-level worksheets mix tally charts, picture graphs, and bar graphs and include both direct reading and two-step comparison questions. Students ready for more challenge work well with incomplete graph worksheets: a bar graph with two bars drawn and two left blank, paired with a data table they must use to finish the display. Asking those students to write two of their own questions — with answer keys — builds interpretive thinking that moves well beyond copying a format. A practical move that takes almost no extra prep is giving all students the same graph while varying the question worksheets by demand level; whole-class discussion can include everyone because they all read the same information, even when the written response differs.
Frequently Asked Questions
What standard do these worksheets address?
The set targets CCSS 3.MD.B.3, which covers drawing and reading scaled picture graphs and scaled bar graphs and solving one- and two-step comparison problems. Some worksheets also support 3.MD.B.4 through data collection and tally chart tasks.
Do the worksheets include answer keys?
Yes. Answer keys show correct responses and, for comparison questions, include the equation so teachers can quickly distinguish between a student who had the right process but made a calculation error and one who did not understand the question at all.
Can I use these worksheets for homework?
Shorter worksheets — one graph with four to six questions — work well as homework. Avoid sending home assignments that mix multiple graph types until students have demonstrated each skill in class; picture graph keys and bar graph axes require different interpretive steps, and confusion compounds without teacher support nearby.
How are these different from general graphing worksheets?
These 3rd grade statistics printable worksheets resources stay within the specific Grade 3 scope defined by 3.MD.B.3 — scaled graphs, comparison questions, and the movement between data representations. Many general graphing worksheets include line plots, circle graphs, or coordinate grids that belong to later grade levels, and introducing those formats before students have the number-line understanding to use them accurately tends to create confusion rather than build fluency.