


























Views
Downloads
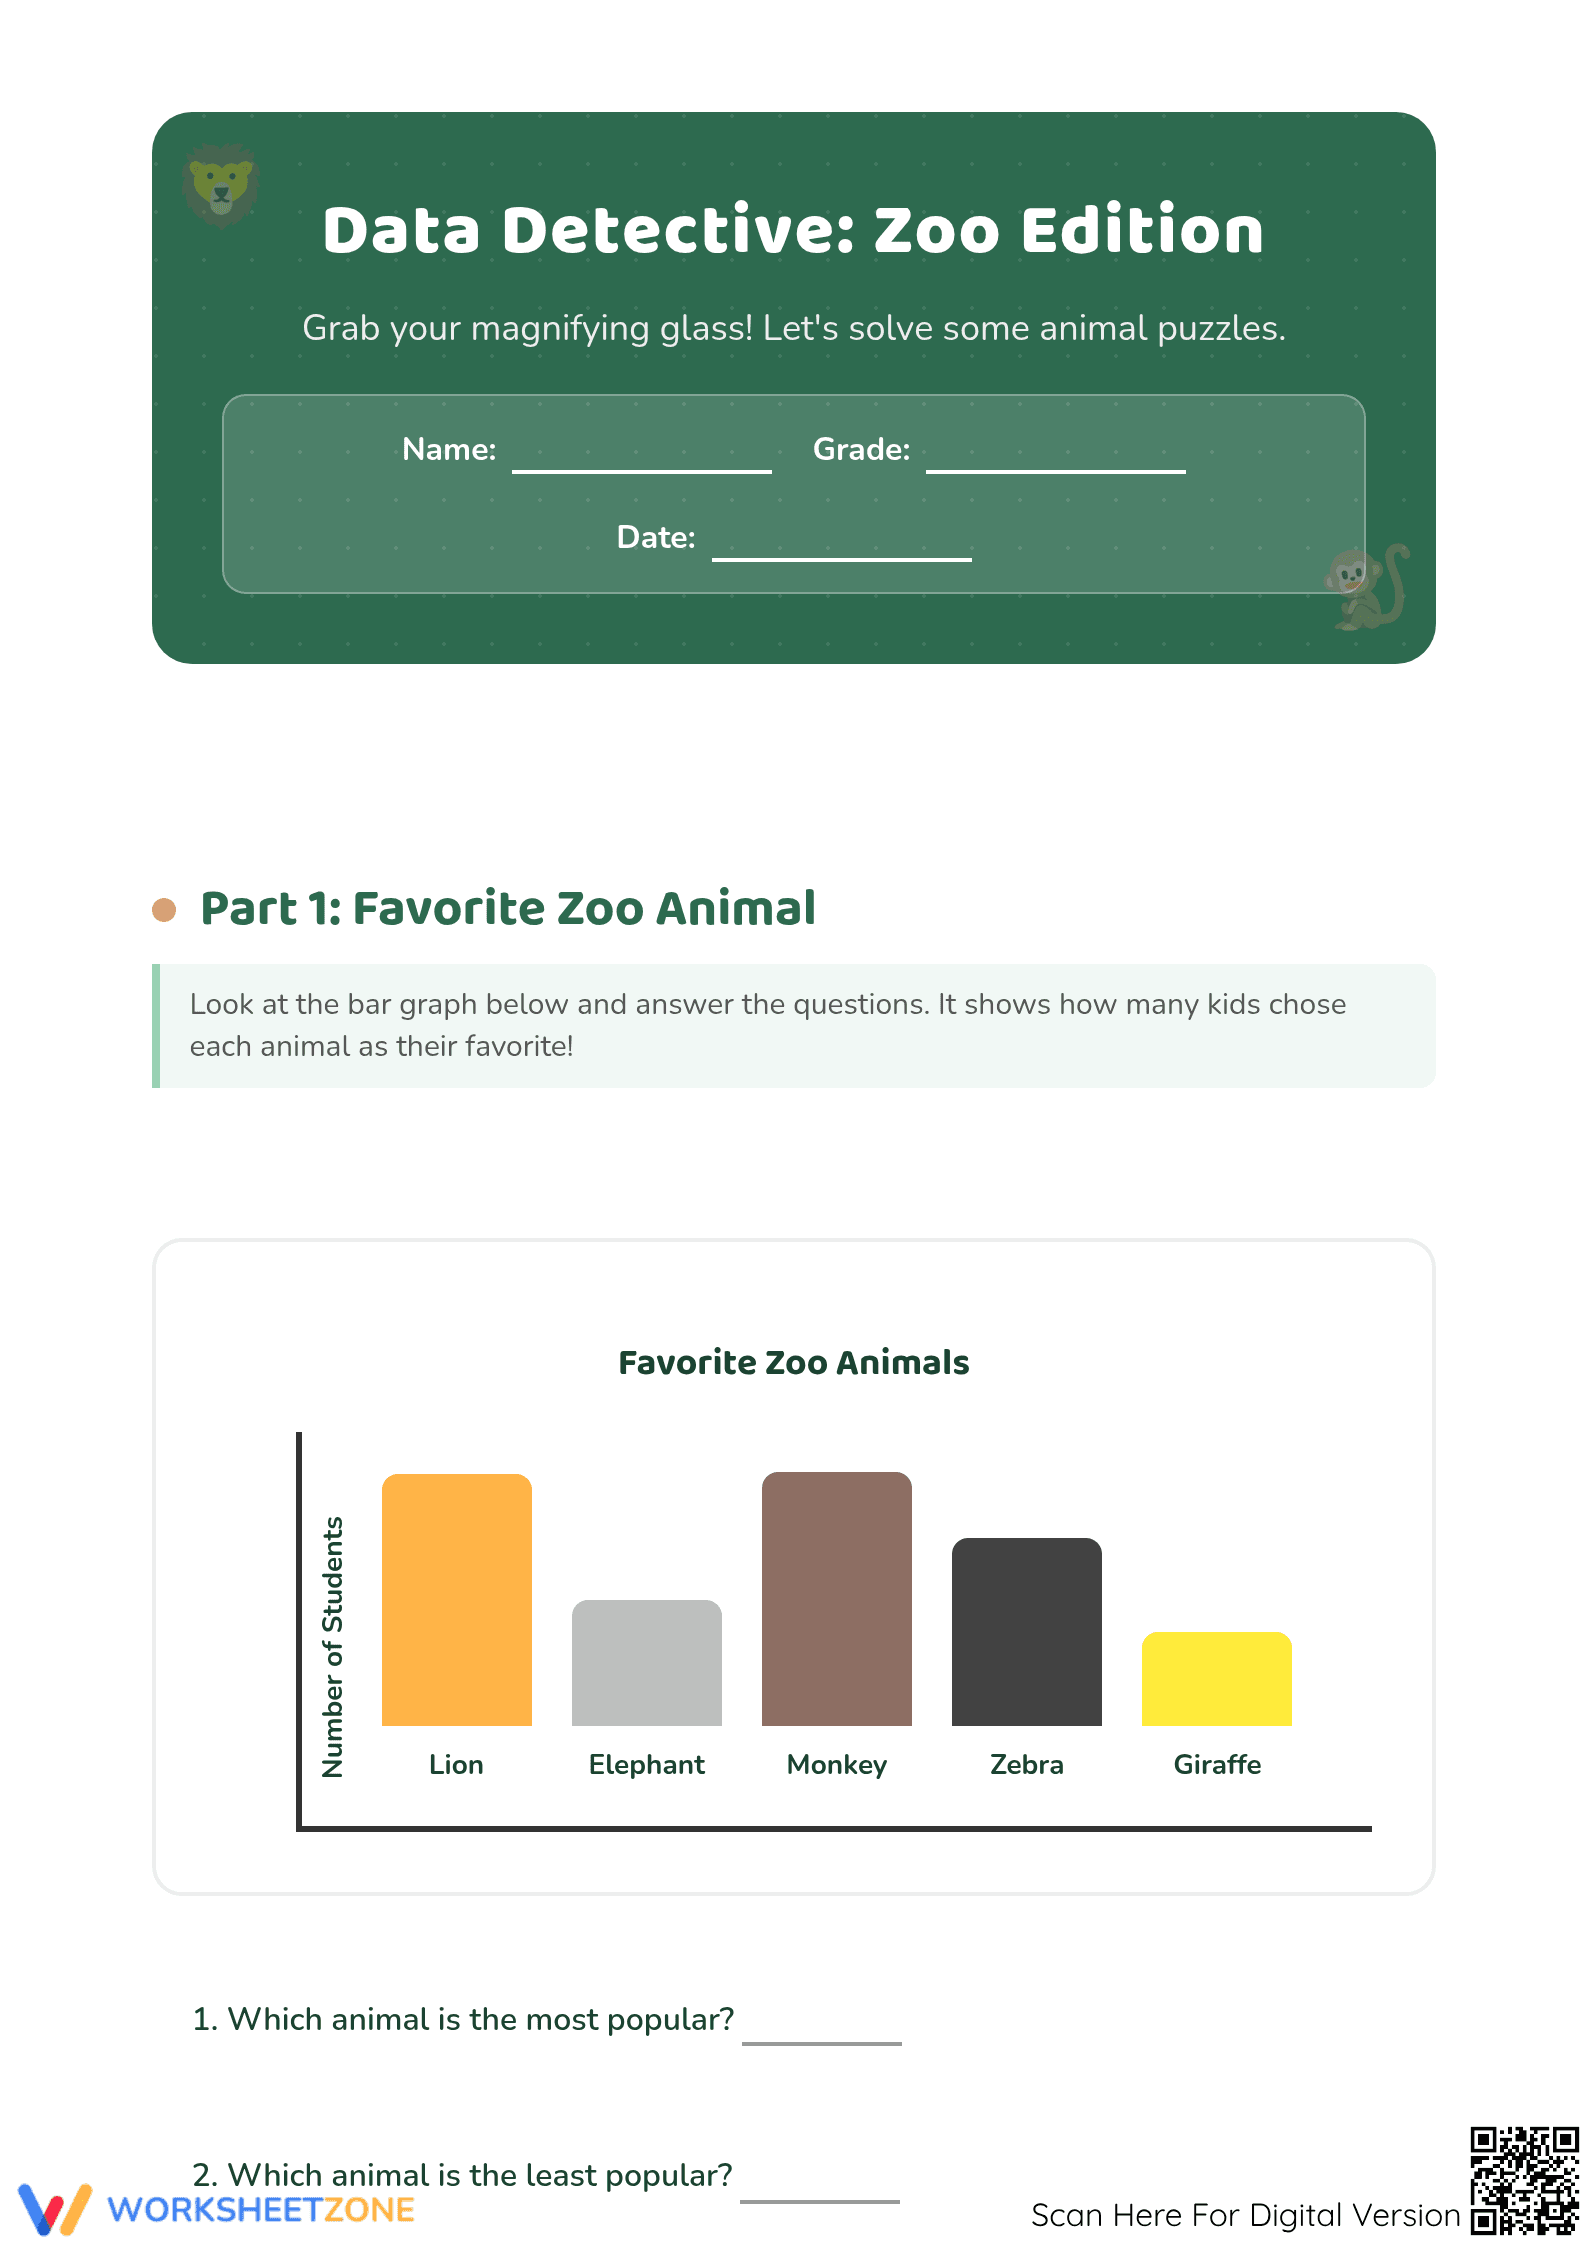

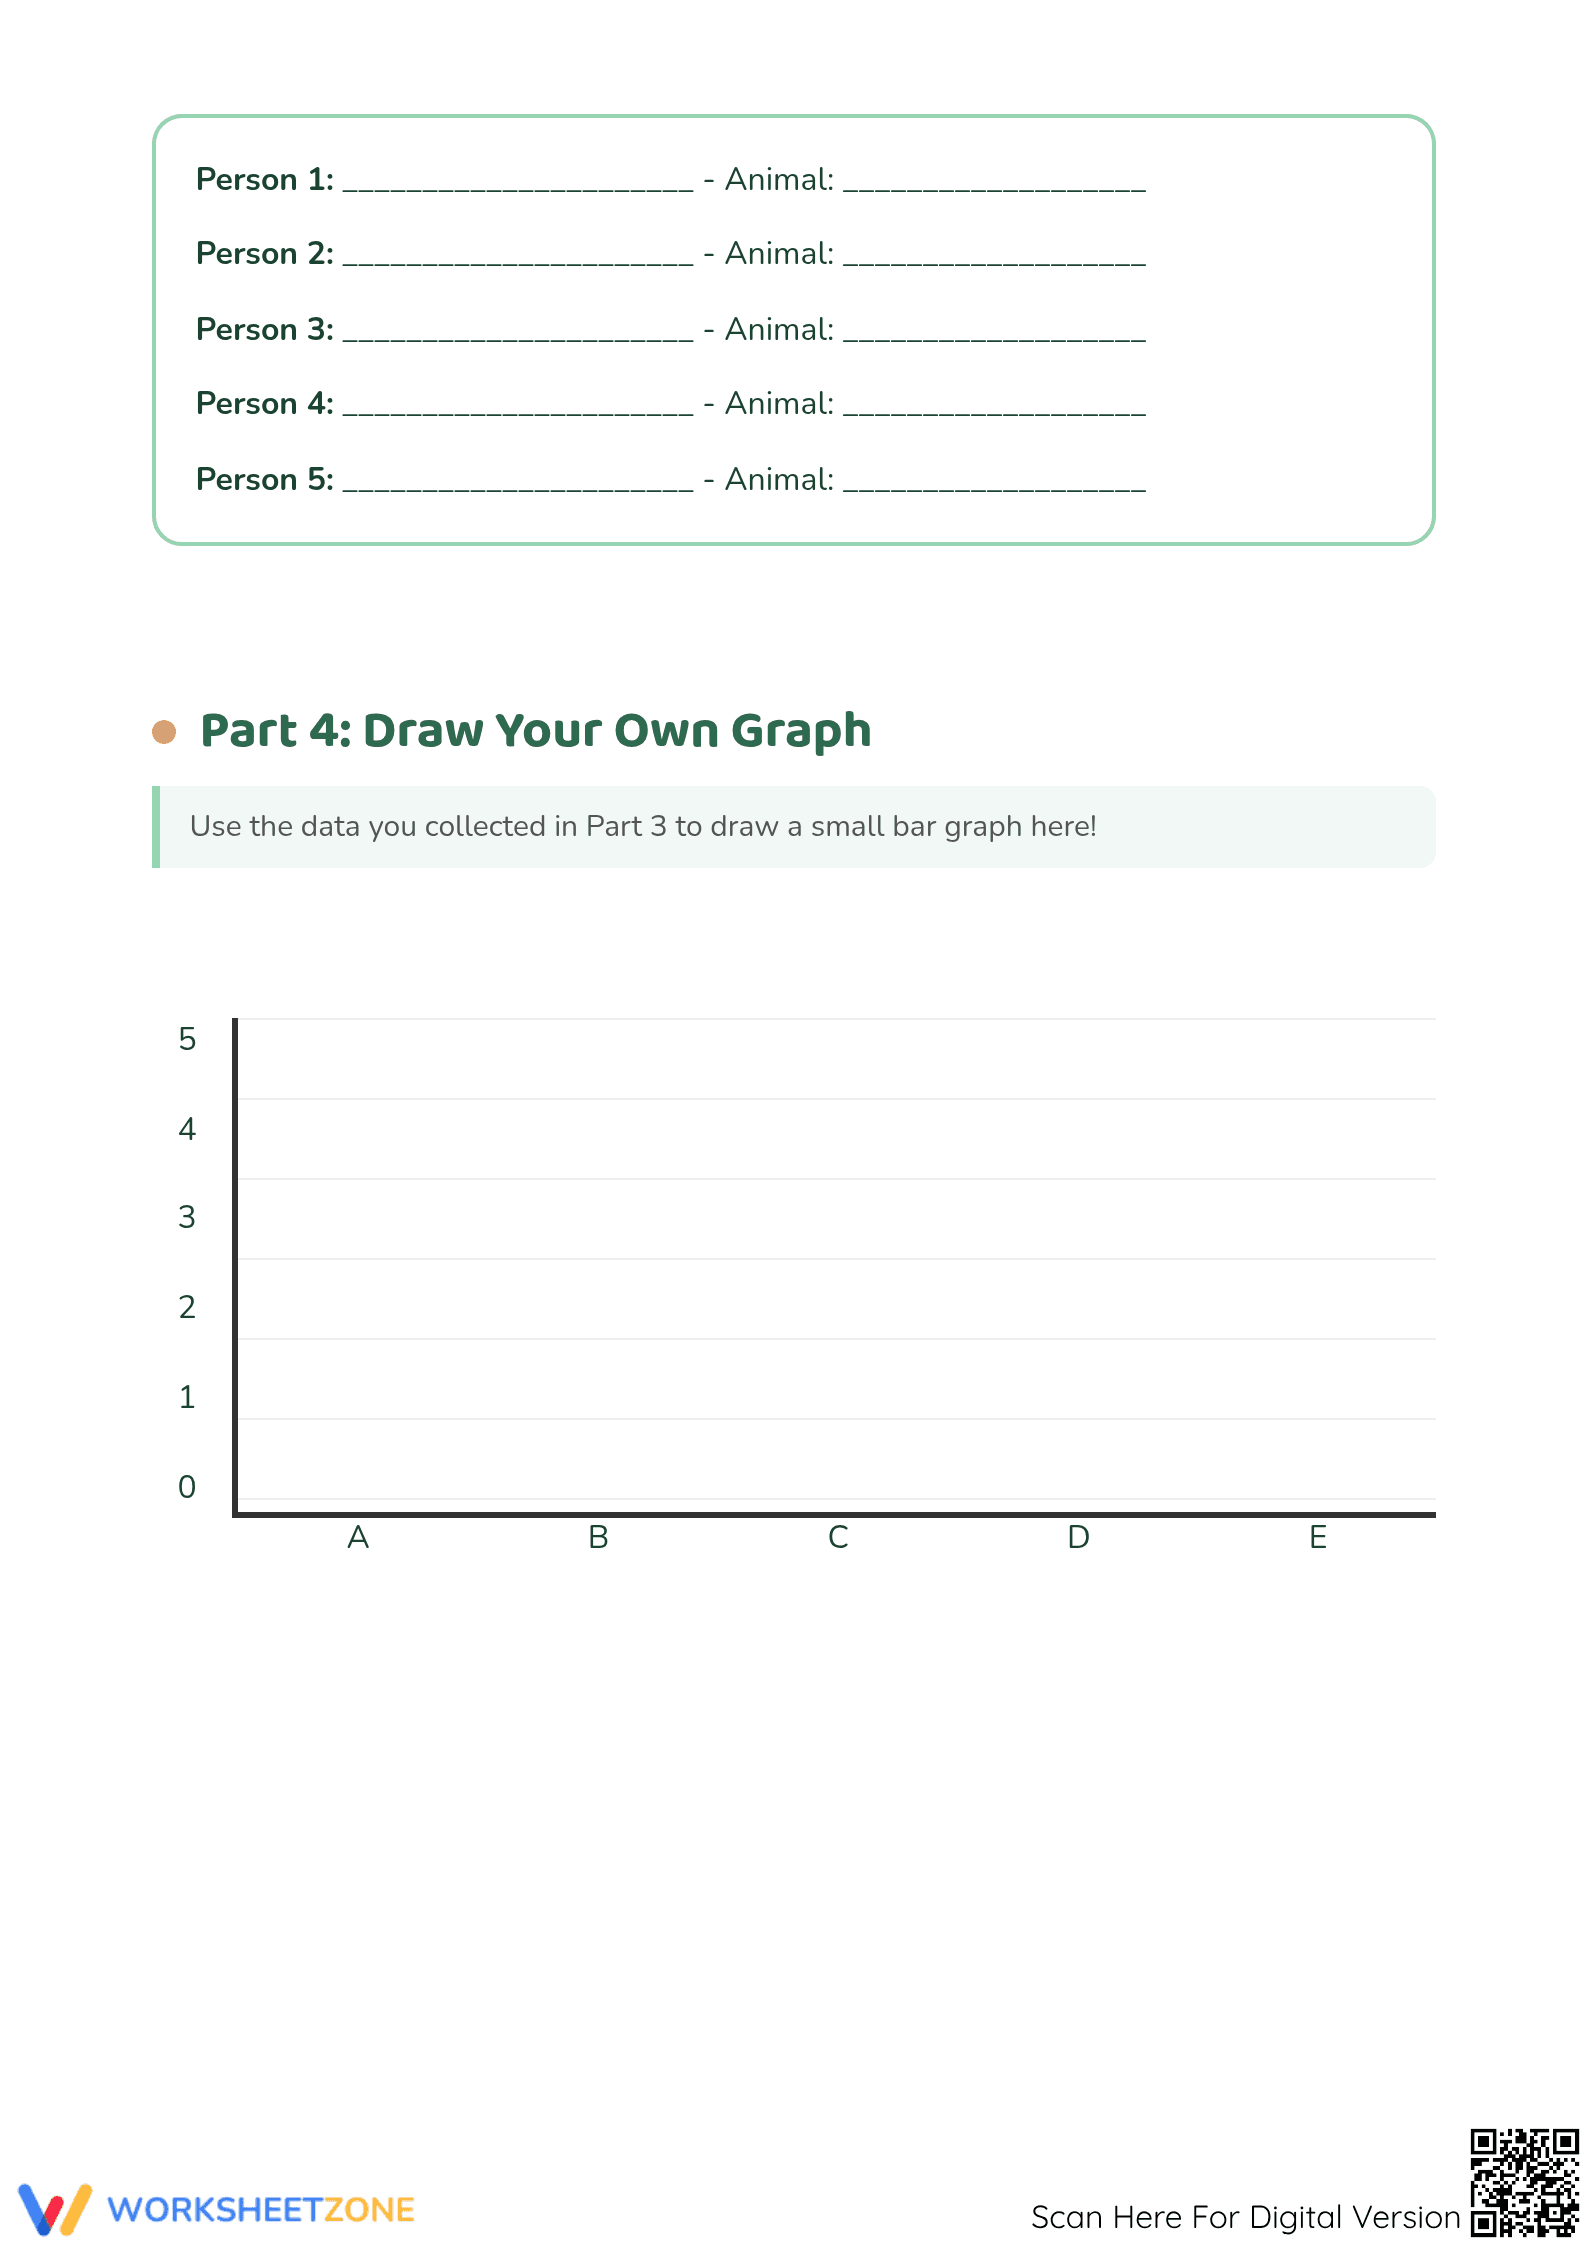

Grade 1 Bar Graphs — Printable No-Prep Worksheet
Paste this activity's link or code into your existing LMS (Google Classroom, Canvas, Teams, Schoology, Moodle, etc.).
Students can open and work on the activity right away, with no student login required.
You'll still be able to track student progress and results from your teacher account.
Engaging Data Practice for Young Learners
This worksheet provides a complete, hands-on activity for students to master early graphing skills. Learners will use data from a colorful zoo animal chart to build their own bar graph, and then use that visual information to answer seven analysis questions. It’s an ideal resource for introducing data representation in a way that is both accessible and fun for primary-grade students.
At a Glance
- Grade: K–2 · Subject: Math
- Standard:
CCSS.MATH.CONTENT.1.MD.C.4— Organize, represent, and interpret data with up to three categories.- Skill Focus: Creating and Interpreting Bar Graphs
- Format: 3 pages · 8 problems · Answer key included · PDF
- Best For: Independent practice, math centers, or formative assessment.
- Time: 15–25 minutes
What's Inside
This three-page PDF resource includes a page for students to count and graph nine zoo animals, followed by a page with seven analysis questions to interpret their bar graph. The final page provides a complete answer key, facilitating quick grading and student self-checking.
A Zero-Prep Workflow
Designed for busy teachers, this worksheet offers a simple, efficient, and high-quality experience with less than two minutes of preparation time.
- Print (1 min): The PDF is formatted for easy printing. Just print the first two pages for each student.
- Distribute (30 sec): Hand out the worksheet along with crayons or colored pencils for the graphing portion.
- Review (5-10 min): Use the included answer key to review the graph and questions as a whole class or to check work individually.
This resource is an excellent choice for a last-minute lesson, a substitute teacher plan, or a simple, effective homework assignment.
Standards Alignment
Directly aligned with Common Core standard CCSS.MATH.CONTENT.1.MD.C.4, this activity requires first-grade students to organize, represent, and interpret data, and to answer questions comparing categories. Completing the graph and analysis questions helps students demonstrate proficiency in this key data skill.
How to Use It
This versatile worksheet suits various instructional settings. Use it for guided practice after a lesson, as an independent math center activity, or for formative assessment. Observe students as they complete the task to gauge their understanding of graphing and data analysis. Most students will finish in 15 to 25 minutes.
Who It's For
Designed for K-2 students new to data and graphing, this worksheet's clear layout, fun zoo animal theme, and manageable tasks make it accessible. It's especially effective for visual learners. Enhance engagement by pairing it with a virtual zoo trip or relevant storybook.
This resource provides targeted practice on CCSS.MATH.CONTENT.1.MD.C.4, fostering a foundational understanding of data representation. Early exposure to data analysis, even with simple bar graphs, is crucial for developing future statistical reasoning skills and critical thinking, as supported by educational research. This activity allows learners to actively organize, visualize, and interpret data, engaging them in a complete data cycle.


