


























Views
Downloads

Grade 3 Graphing — Printable No-Prep Worksheet
Paste this activity's link or code into your existing LMS (Google Classroom, Canvas, Teams, Schoology, Moodle, etc.).
Students can open and work on the activity right away, with no student login required.
You'll still be able to track student progress and results from your teacher account.
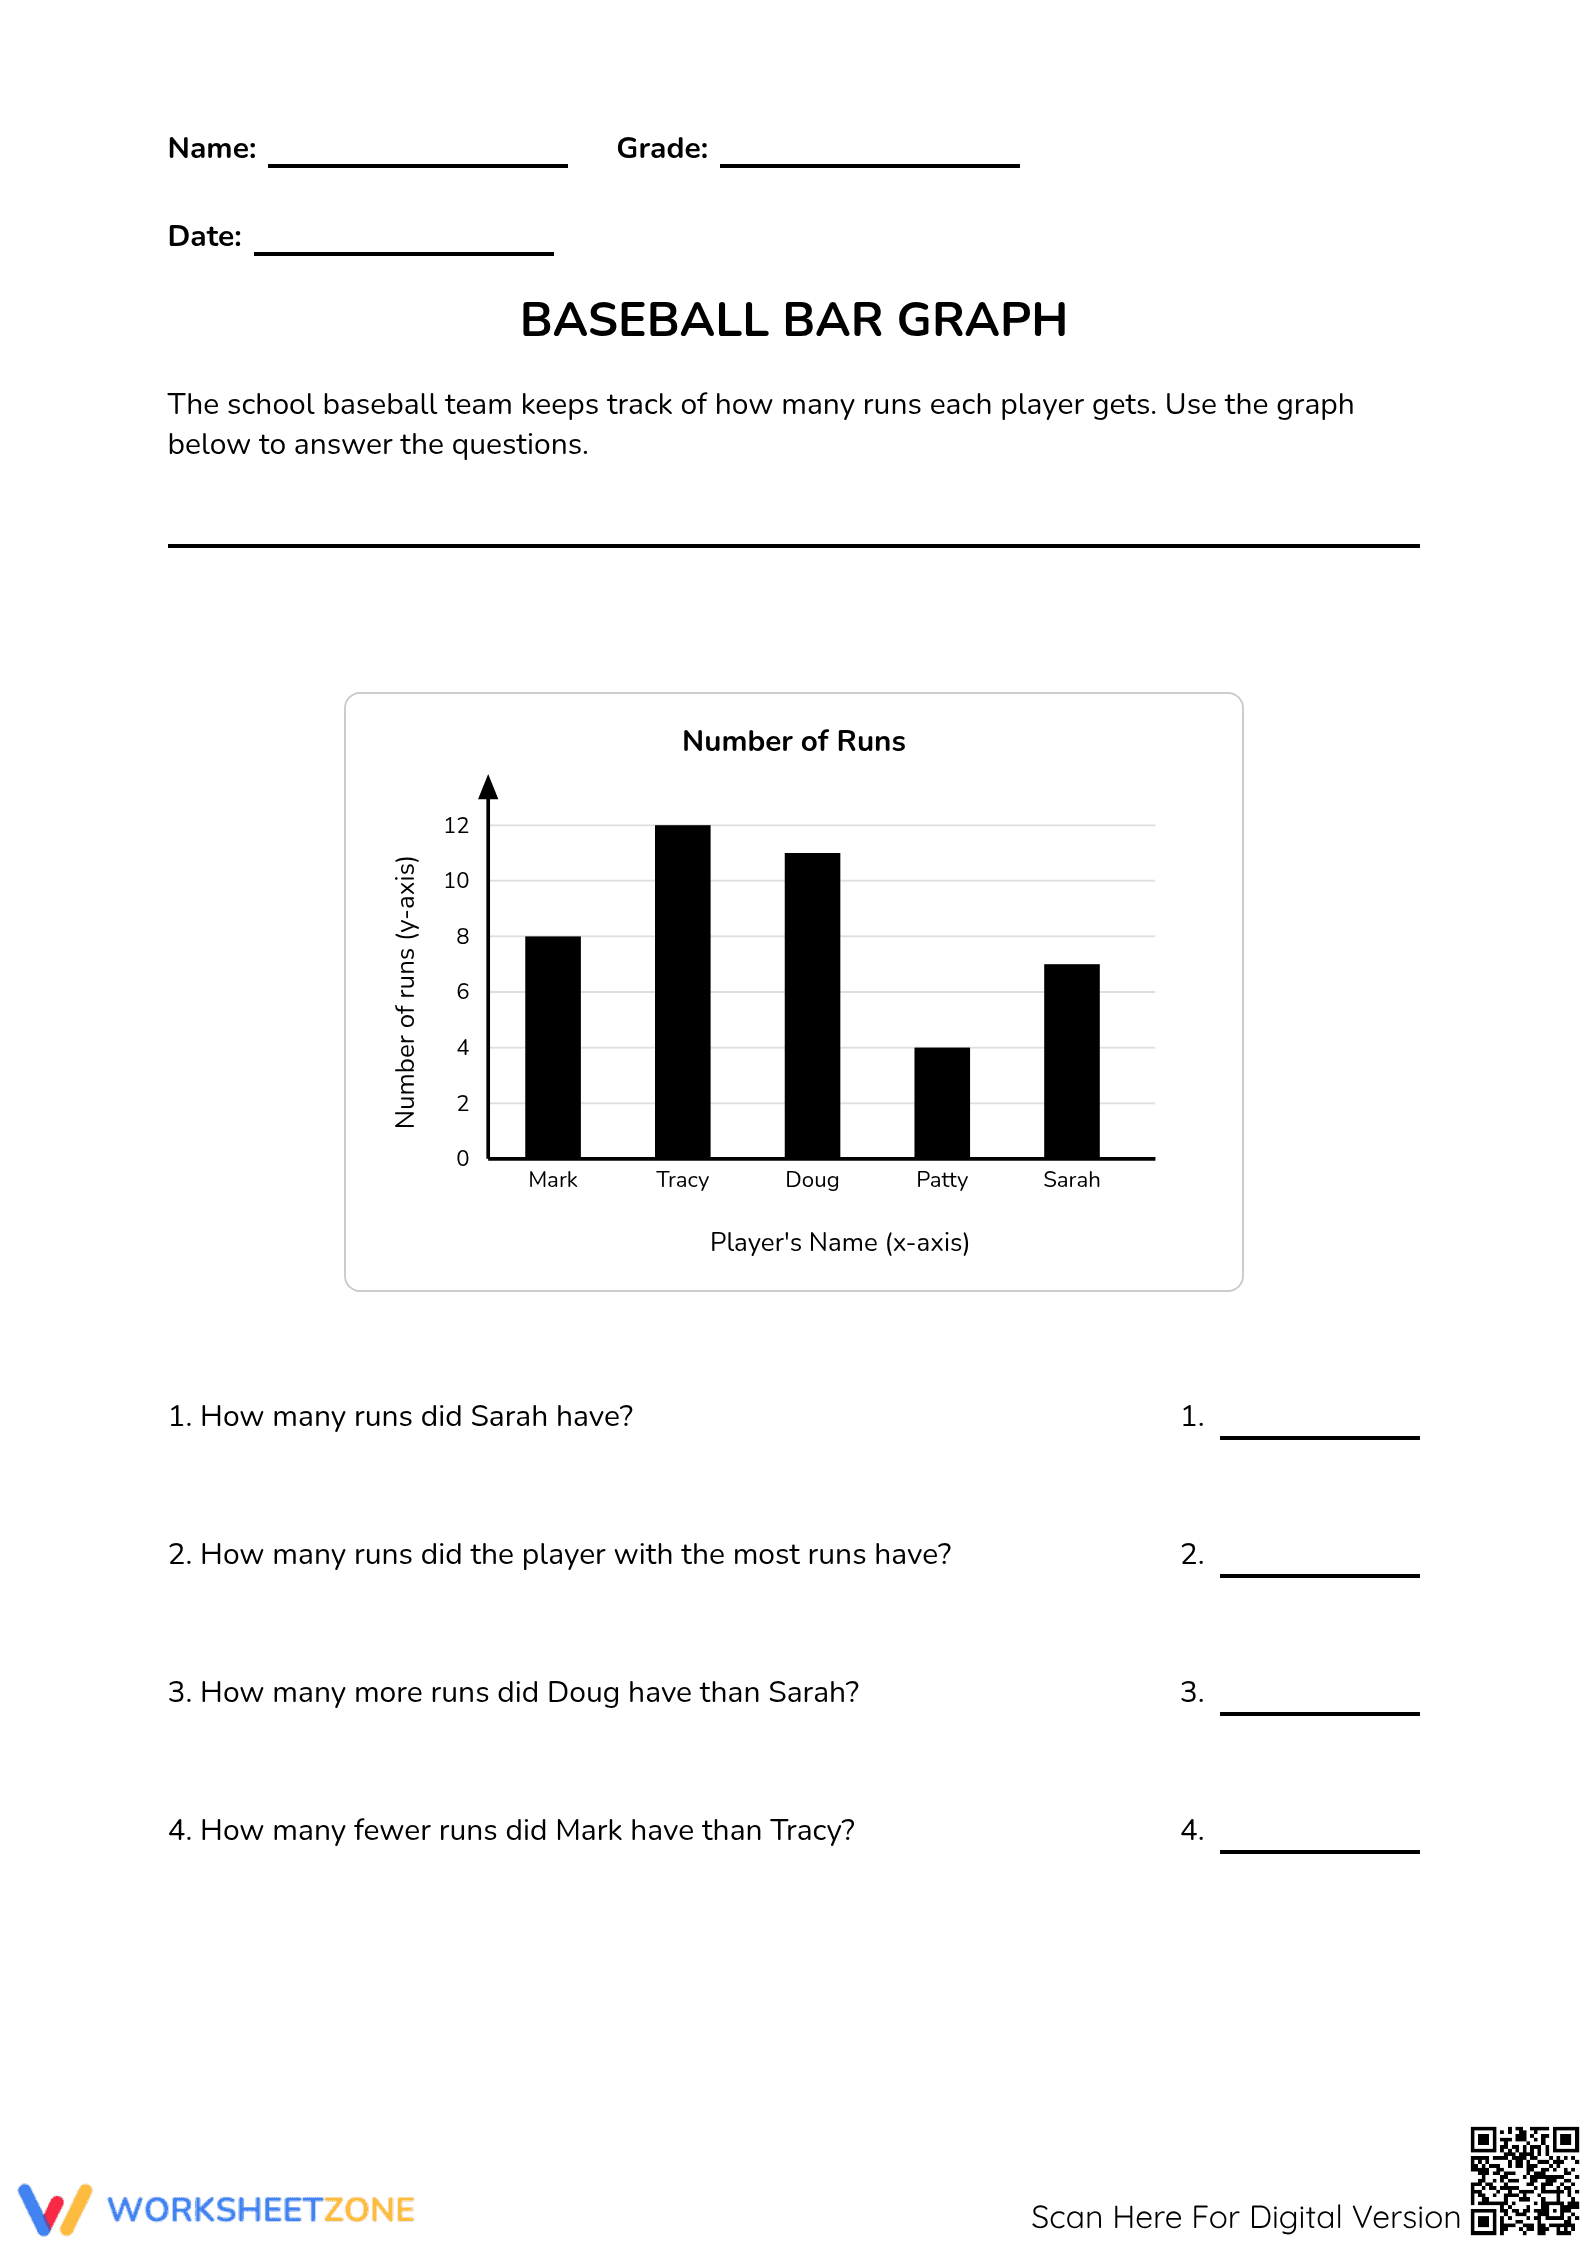
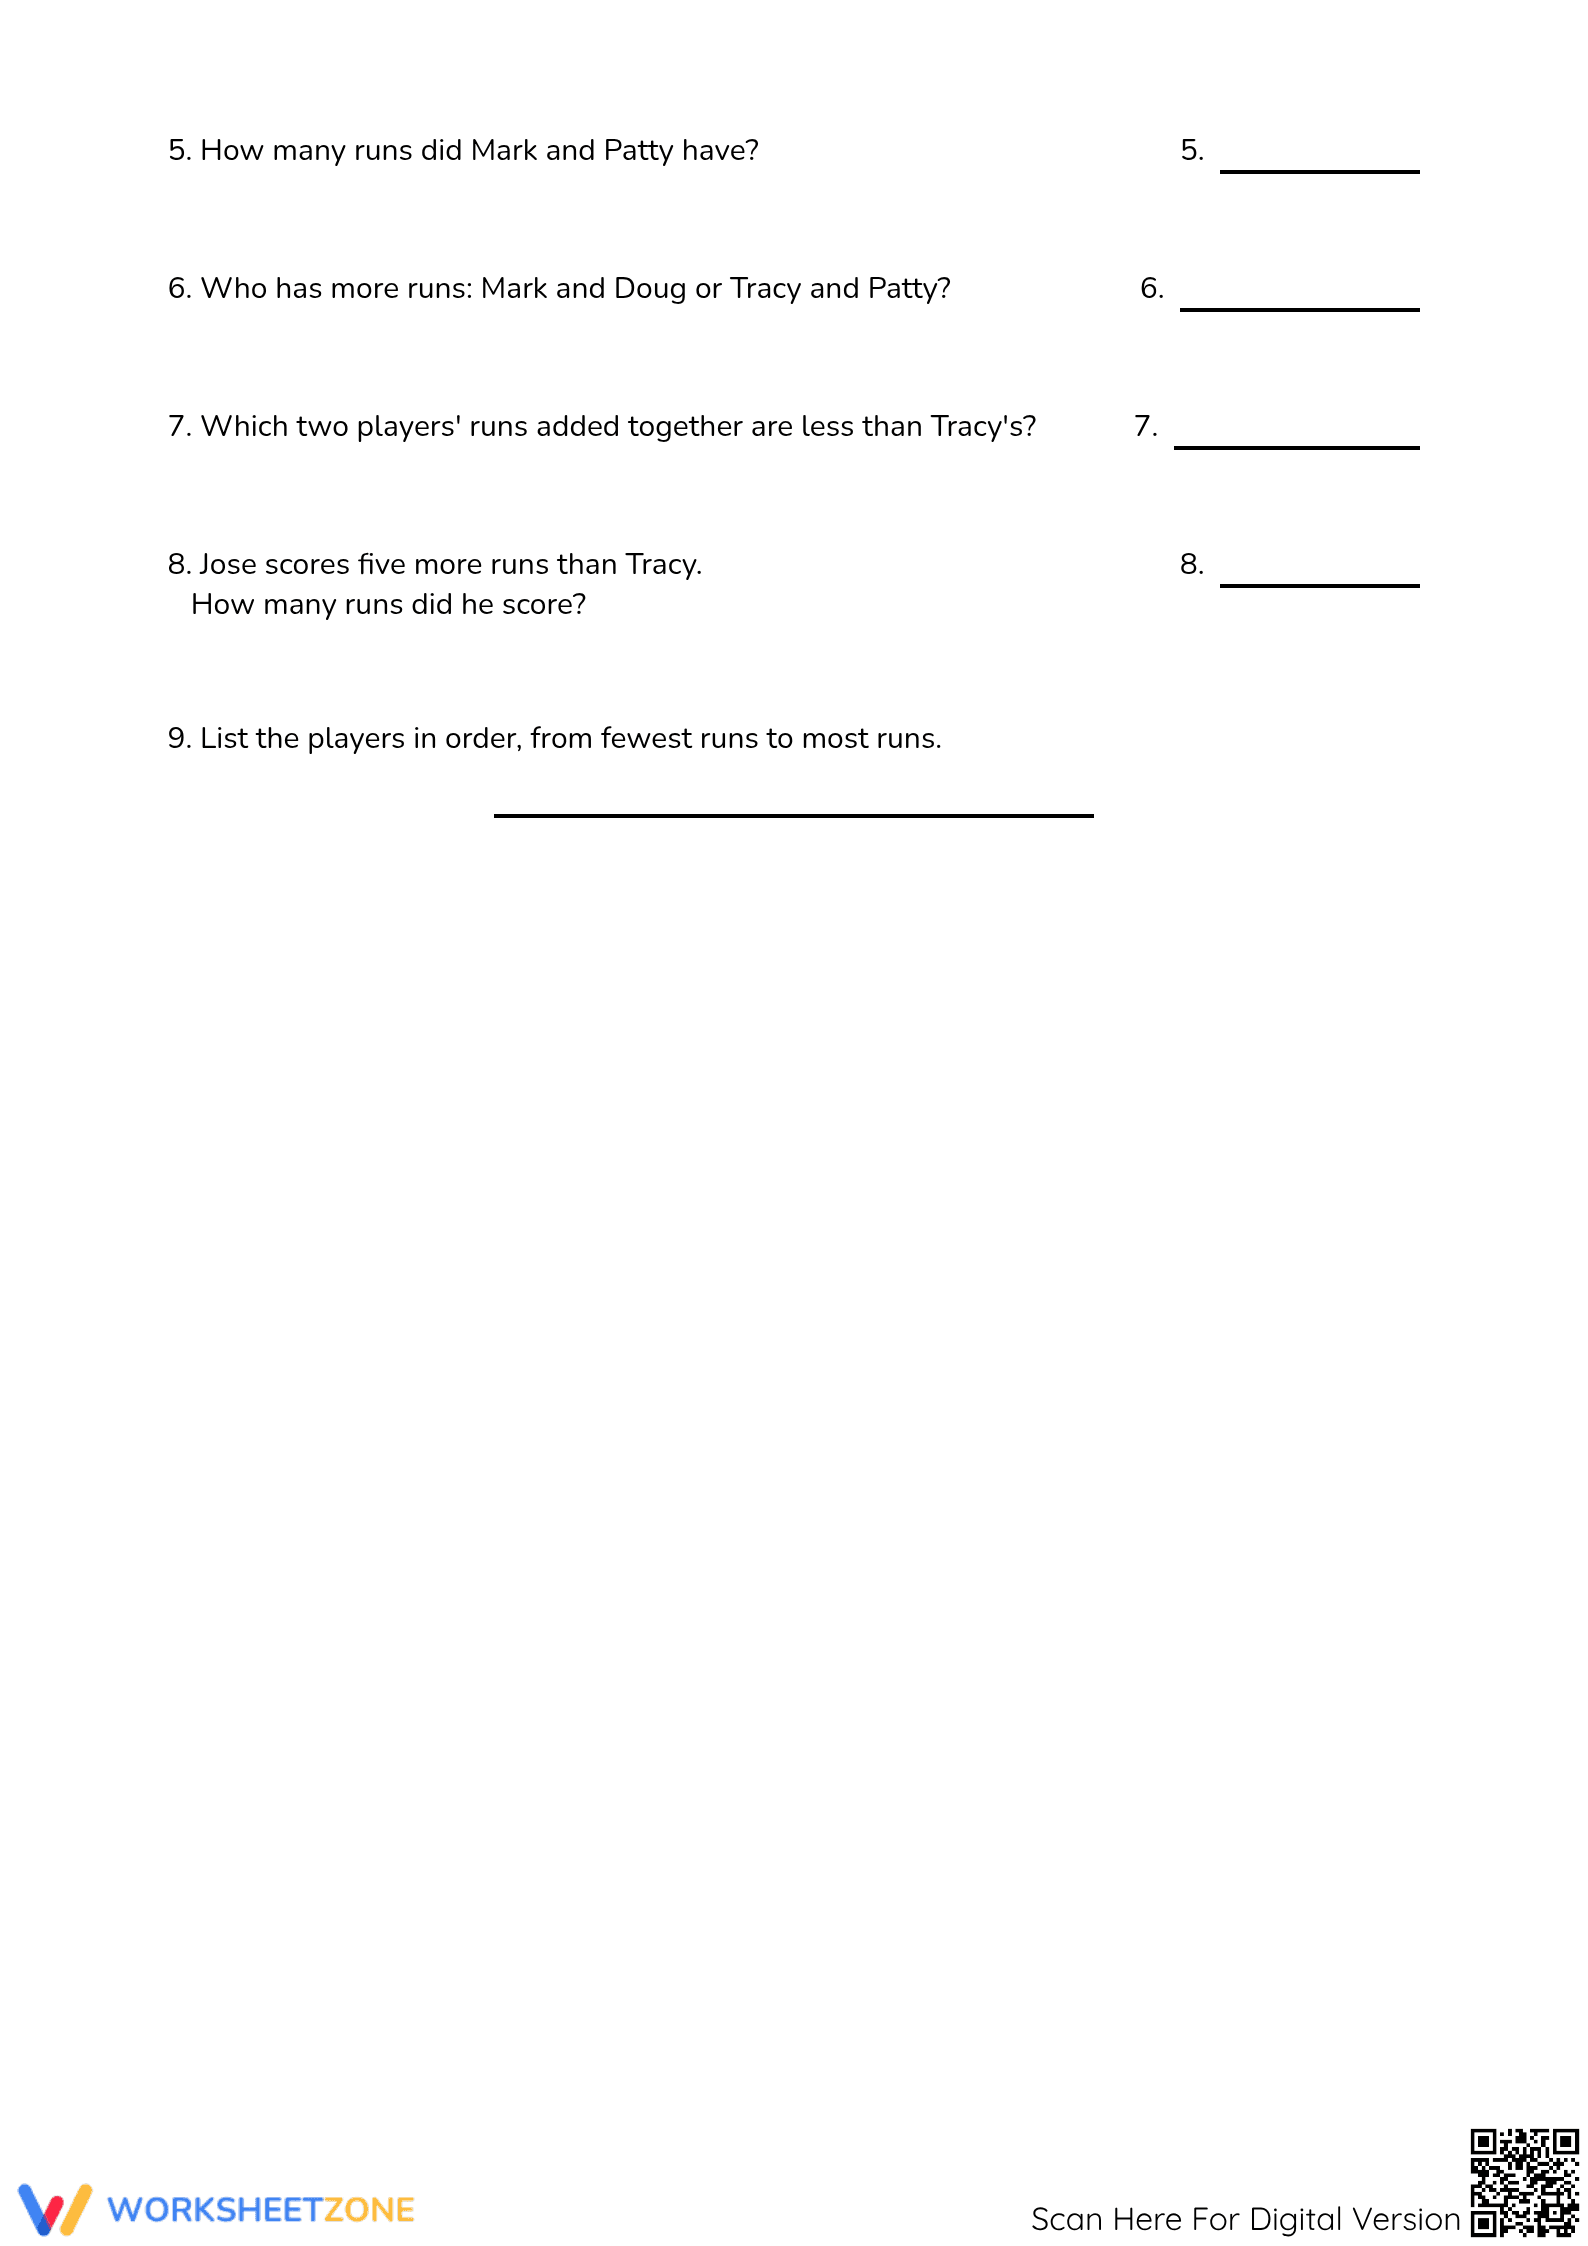
This Grade 3 math worksheet provides targeted practice in reading and interpreting bar graphs. Students will use the data from a baseball-themed graph to answer five comprehension questions, strengthening their ability to analyze data and draw simple conclusions. It’s an essential, ready-to-use resource for any measurement and data unit.
At a Glance
- Grade: 3 · Subject: Math
- Standard:
CCSS.MATH.CONTENT.3.MD.B.3— Represent and interpret data using scaled bar graphs.- Skill Focus: Reading Bar Graphs, Data Interpretation
- Format: 2 pages · 5 problems · Answer key included · PDF
- Best For: Independent practice, formative assessment, homework
- Time: 10–15 minutes
What's Inside
This resource includes a single-page worksheet and a corresponding answer key for quick grading. The student page features a bar graph on baseball teams and five direct questions. The design is clean, ensuring students can focus on analyzing the data.
A Time-Saving Classroom Workflow
This worksheet is designed for minimal teacher prep.
- Print (1 min): Print the two-page PDF (worksheet and key).
- Distribute (1 min): Hand out the self-contained single page to students.
- Review (5 mins): Grade work quickly using the provided answer key.
With under 10 minutes of teacher time required, it's a perfect choice for math centers, sub plans, or homework.
Standards-Based Practice
This worksheet is directly aligned with Grade 3 standard CCSS.MATH.CONTENT.3.MD.B.3, which focuses on representing and interpreting data in scaled bar graphs. This targeted practice helps students solve "how many more" and "how many less" problems. The standard code can be copied directly into lesson plans or curriculum maps.
How to Use in Your Classroom
Use this worksheet as independent practice after a lesson on bar graphs or as a quick formative assessment. As students work, observe how they use the graph's scale to find the value for each bar. It also serves as an effective homework assignment or a math station activity. Most students will complete the five questions in 10-15 minutes.
Built for the Grade 3 Classroom
This activity is designed for third-grade students who are learning to work with data and graphs. The clear layout and familiar topic of baseball make the task accessible and engaging. For students needing extra support, consider completing the first question together as a class. This resource pairs well with an anchor chart that defines key graph elements like the title, axes, and scale.
This worksheet provides practice for CCSS.MATH.CONTENT.3.MD.B.3, a key standard for data literacy. By having students interpret a bar graph, the activity builds a foundation for complex data analysis. Research from the NAEP shows students need repeated practice with data representation to gain proficiency. This resource addresses that need with a clear data set and focused questions. According to Fisher & Frey (2014), such structured, independent tasks are a vital part of a gradual release model, allowing students to consolidate learning after instruction. This worksheet's format facilitates this by providing a concrete task that moves students toward data interpretation mastery.


