


Views
Downloads

Printable Interpreting Bar Graphs Worksheet | Grade 3
Paste this activity's link or code into your existing LMS (Google Classroom, Canvas, Teams, Schoology, Moodle, etc.).
Students can open and work on the activity right away, with no student login required.
You'll still be able to track student progress and results from your teacher account.
Master Data Analysis with Our Bar Graph Worksheets
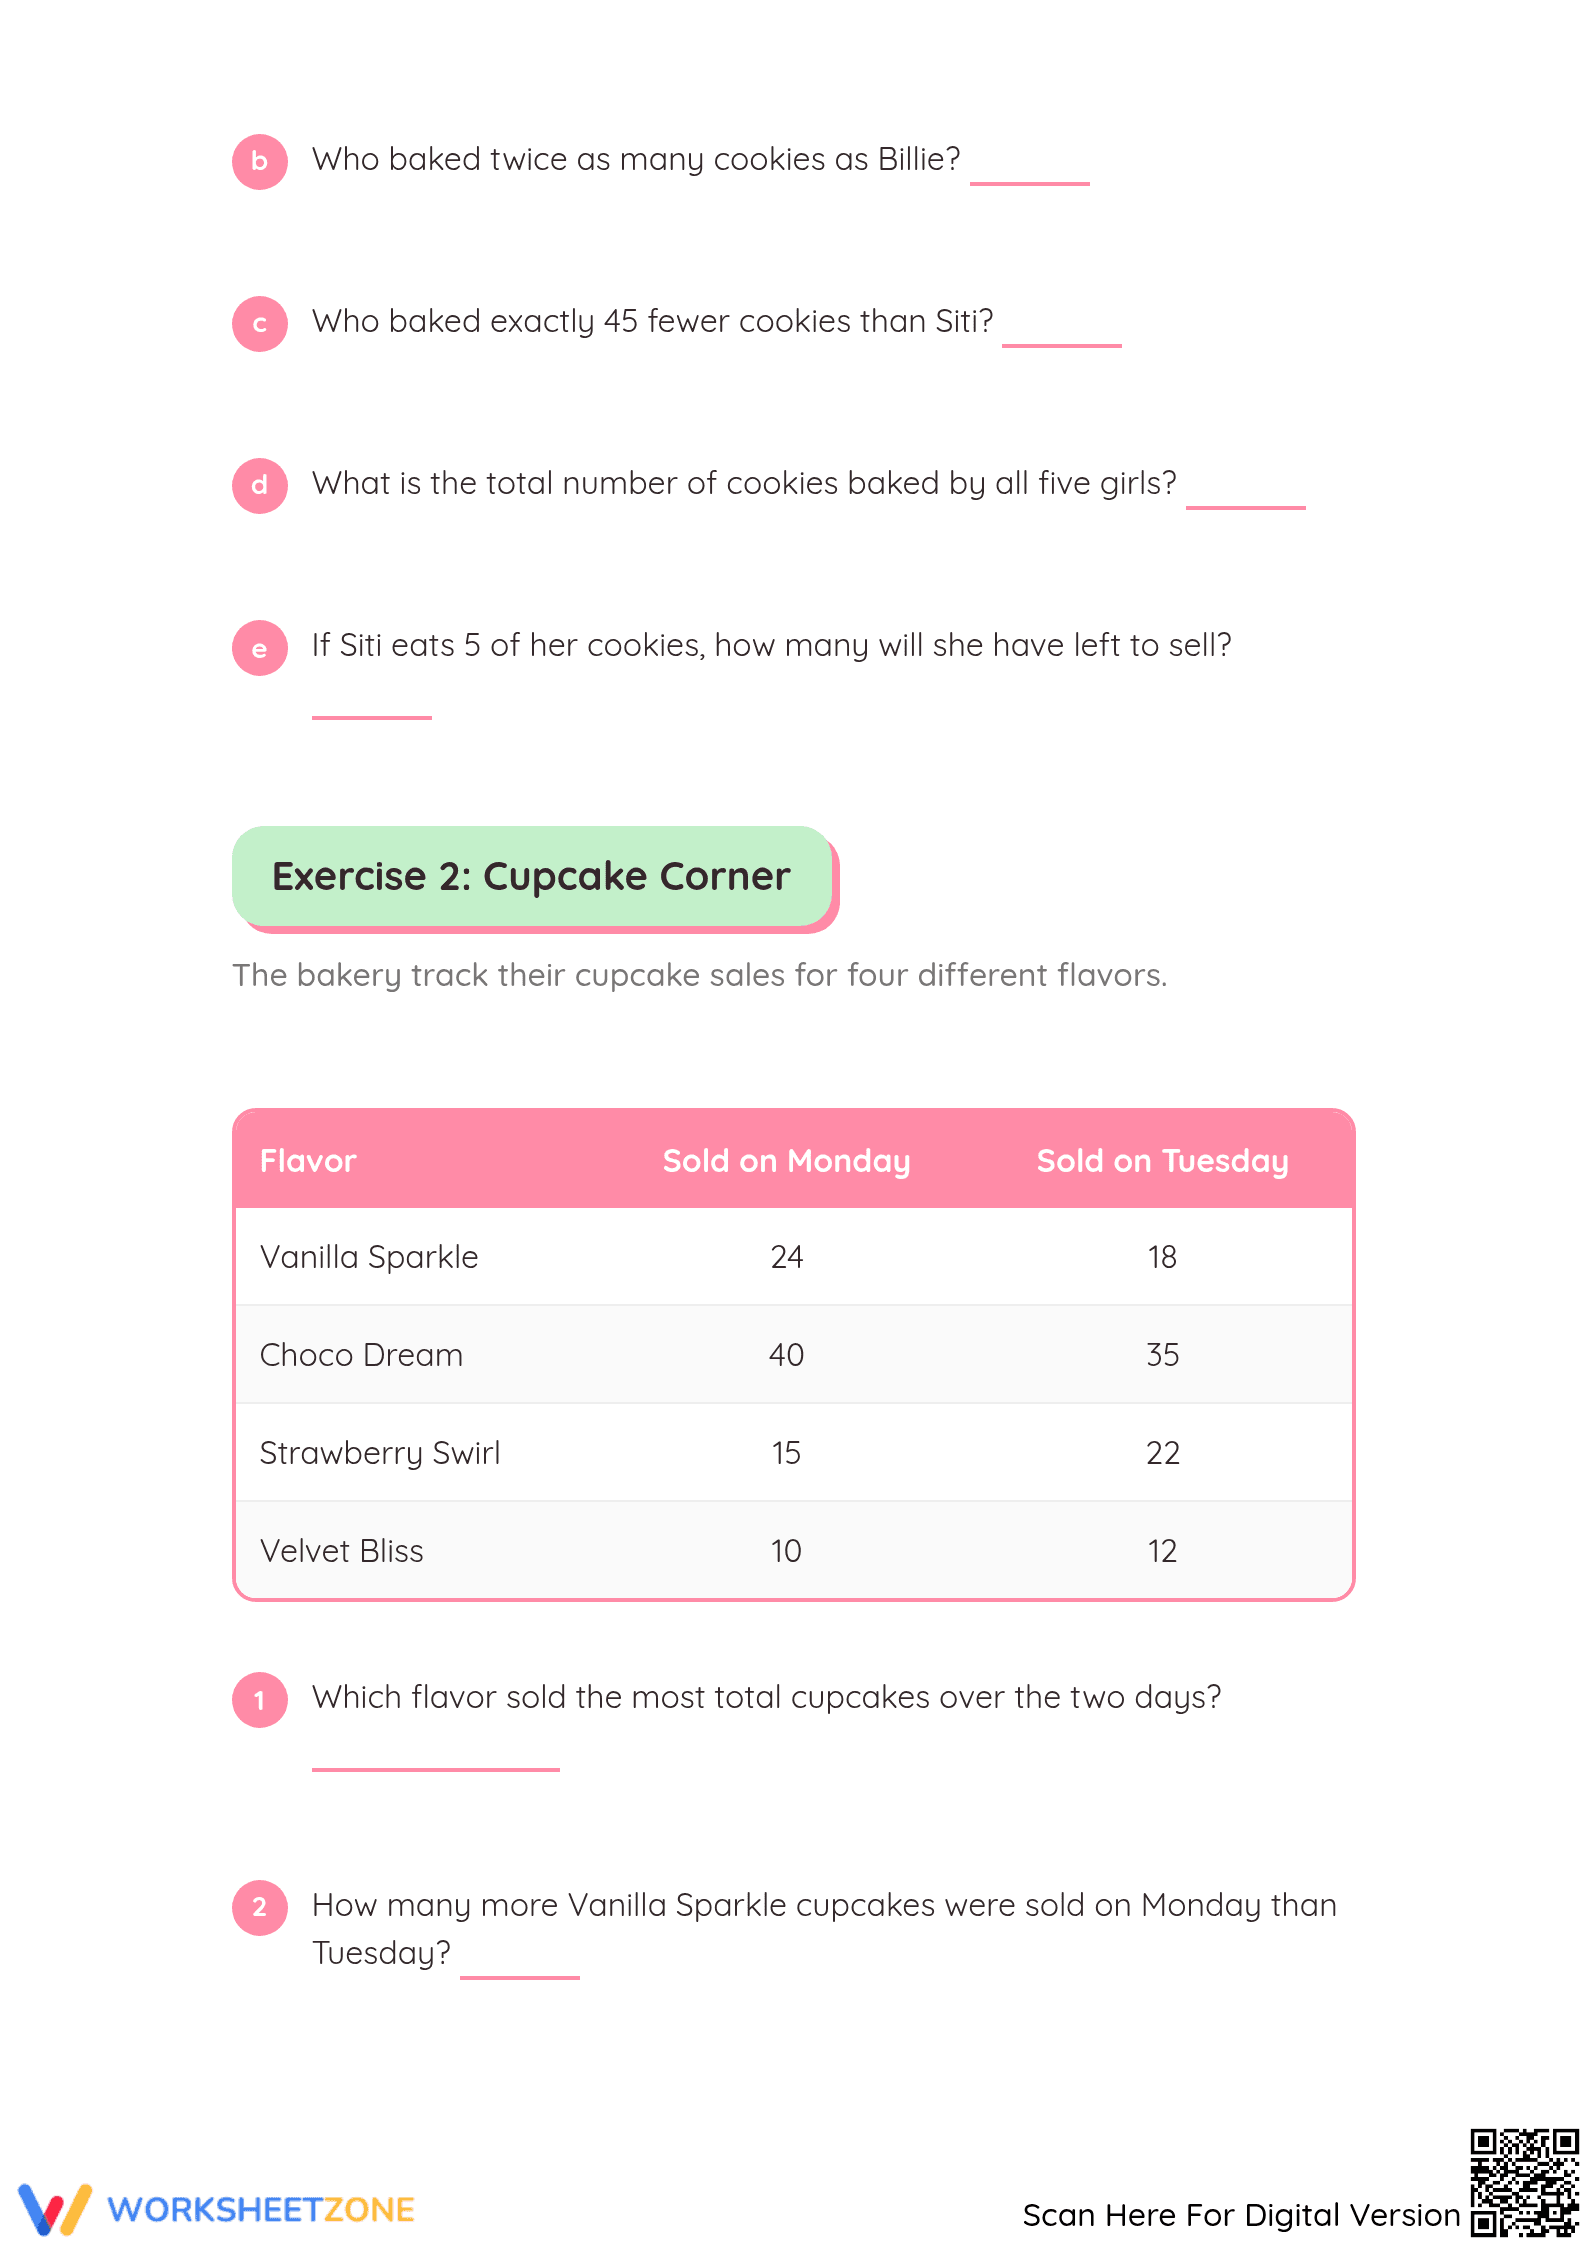
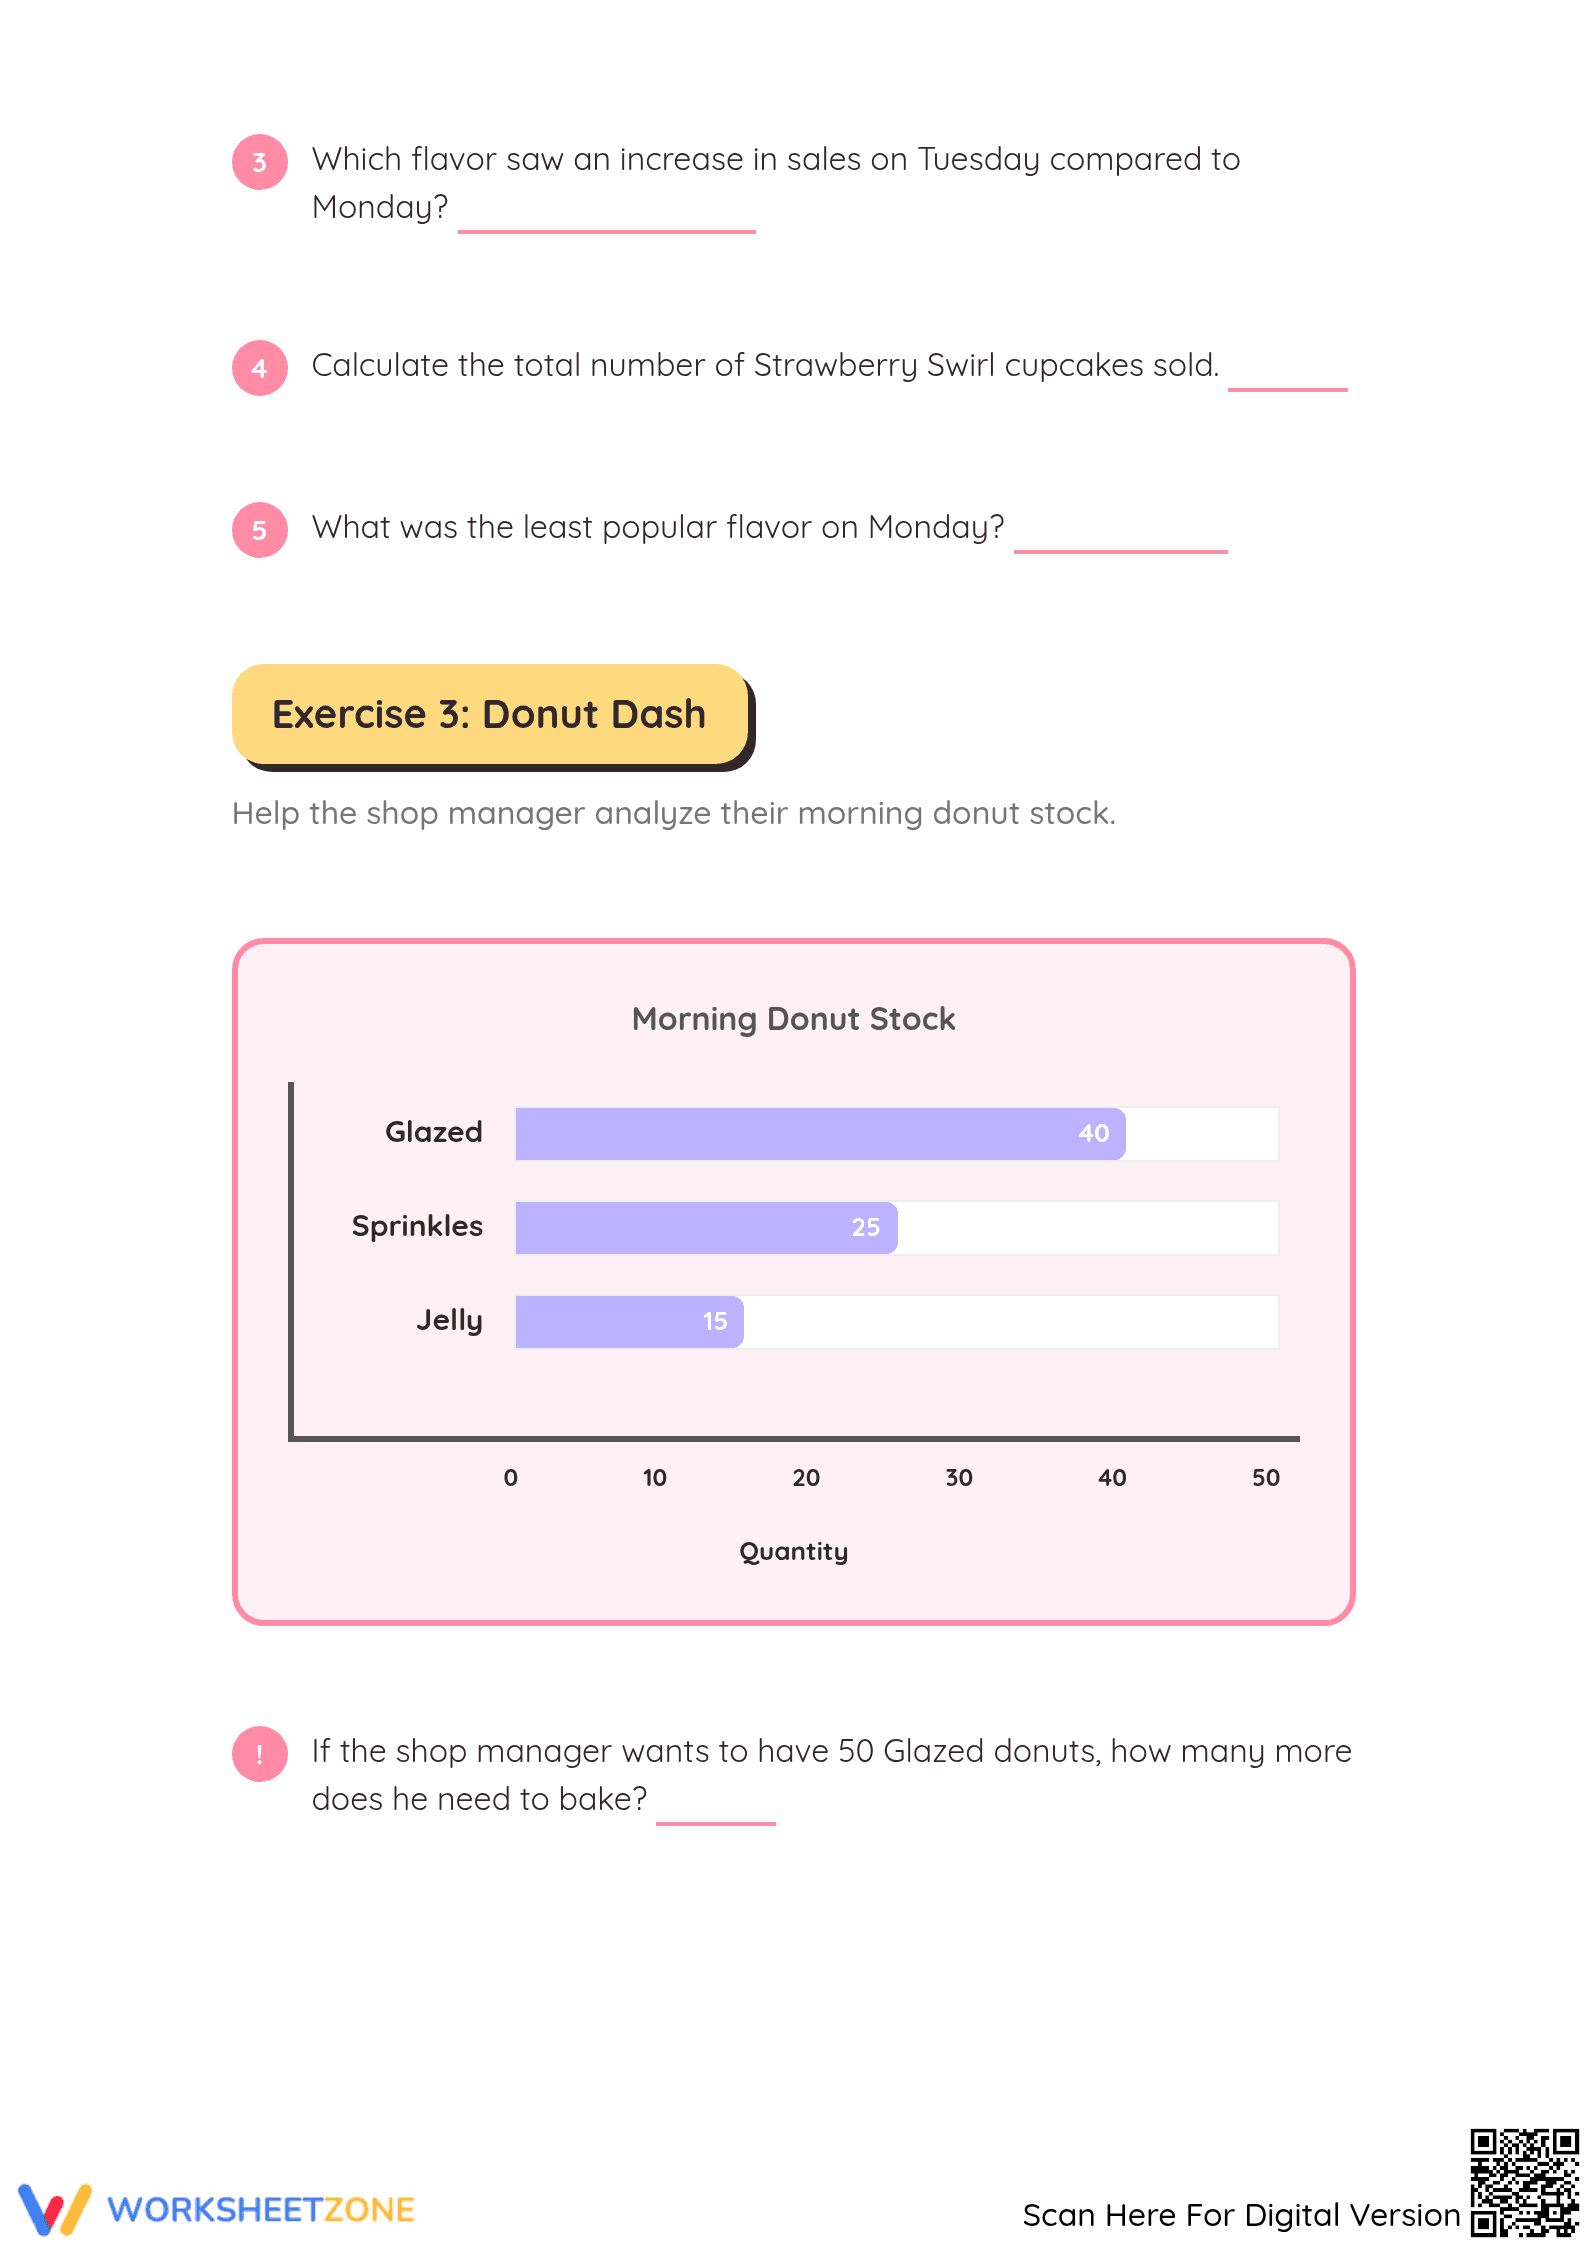
This worksheet provides targeted practice for Grade 3 students on interpreting bar graphs. Through a series of clear and engaging data sets, learners will build confidence in reading graph titles, understanding axes, and using the data to answer comparison questions. It's an essential resource for developing foundational data literacy skills.
At a Glance
- Grade: 3 · Subject: Math, Graphing
- Standard:
CCSS.MATH.CONTENT.3.MD.B.3— Solve problems using information from scaled bar graphs.- Skill Focus: Interpreting Bar Graphs
- Format: 4 pages · 14 problems · Answer key included · PDF
- Best For: Independent practice, station work, or homework
- Time: 20–30 minutes
What's Inside This Bar Graph Worksheet Pack?
This resource includes a four-page worksheet set designed to progressively build students' skills in data analysis. Each page features a unique bar graph with a corresponding set of questions. A complete four-page answer key is also provided, showing the correct solution for all 14 problems, making for quick and easy grading.
A Structure for Skill Mastery
The worksheet set follows a gradual release model to support student learning:
- Guided Practice: The first two worksheets present simple bar graphs with clear, single-step questions, helping students get comfortable with the format.
- Supported Practice: The third worksheet introduces slightly more complex data sets and multi-step questions, encouraging students to combine information from the graph.
- Independent Practice: The final worksheet challenges students with more abstract questions, requiring them to make inferences and perform calculations based on the graph data.
This structure ensures students build a solid foundation before moving to more complex tasks.
Common Core Math Alignment
This worksheet is directly aligned with the following Grade 3 Common Core standard: CCSS.MATH.CONTENT.3.MD.B.3, which states that students should be able to "solve one- and two-step ‘how many more’ and ‘how many less’ problems using information presented in scaled bar graphs." It also supports foundational skills for standard 3.MD.B.4 on generating and plotting measurement data. Both standard codes can be copied directly into lesson plans or curriculum maps.
Classroom Implementation Ideas
This versatile worksheet can be used in several ways. Use it as independent practice after a direct instruction lesson on bar graphs to see which students have mastered the core concept. Alternatively, it serves as a perfect activity for a math station or center-based learning. For a formative assessment, observe which students are correctly identifying the scale of the y-axis before answering. Most students will complete the four pages in approximately 20-30 minutes.
Who Is This Worksheet For?
This resource is designed primarily for third-grade students working on data and graphing units. The clear layout also make it suitable for advanced second graders needing a challenge or fourth graders requiring review. For students needing extra support, pair this activity with a physical set of counting blocks to recreate the bars in the graph, making the data more tangible.
This resource supports the development of skills outlined in CCSS.MATH.CONTENT.3.MD.B.3, focusing on the interpretation of scaled bar graphs. Developing data literacy is a critical component of elementary mathematics. Research from the NAEP has consistently shown that students who can successfully interpret visual data representations perform better on broader mathematical problem-solving tasks. The ability to solve one- and two-step problems using information from graphs is a key indicator of a student's readiness for more complex data sets in later grades. By providing structured practice on this specific skill, this worksheet helps students build the procedural fluency and conceptual understanding necessary for success in mathematics, aligning with findings from Fisher & Frey (2014) on the importance of targeted, independent practice to solidify learning.