These organizing data worksheets printable for 2nd grade give teachers a targeted set of tally chart and frequency table exercises — the specific sorting-and-counting work that sits between raw data and a finished bar graph. Each worksheet presents a data scenario, asks students to record and group, and then pushes them to answer comparison questions using what they've organized. That sequence, practiced repeatedly, is what actually builds the habit of seeing data as something to interrogate rather than just copy.
The Specific Skills Targeted
Each worksheet in the set addresses one or more of the following skills, and the variety across the collection means you can assign them sequentially or pull individual worksheets to address a specific gap:
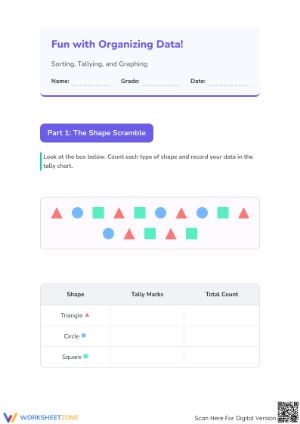
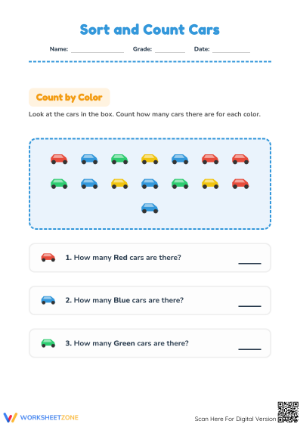
- Recording raw data into a tally chart, with marks grouped in sets of five
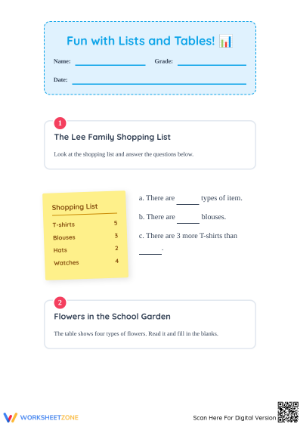
- Converting tally totals into a frequency table using numerals
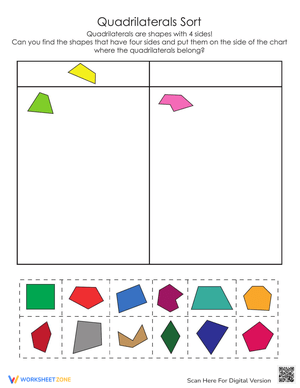
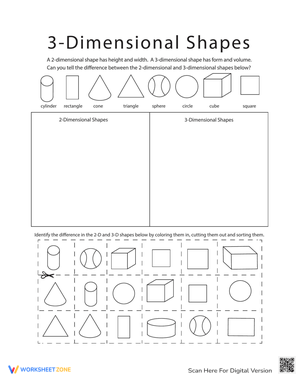
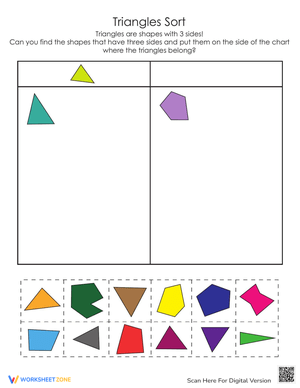
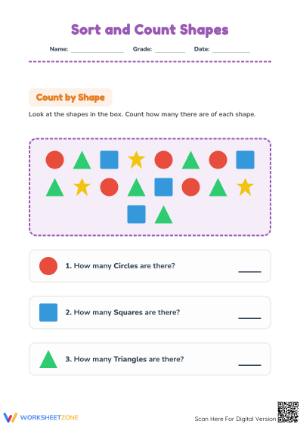
- Identifying and applying up to four categories when sorting a mixed data set
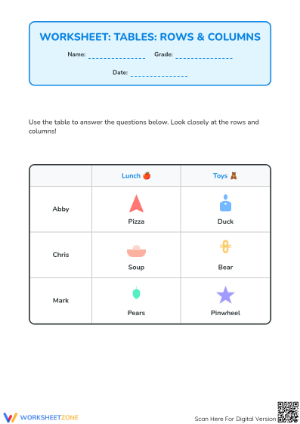
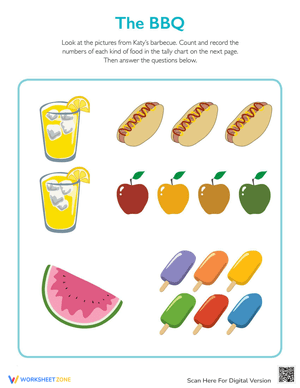
- Answering comparison questions — how many more, how many fewer — from an organized table
- Self-checking by verifying that category totals sum to the original item count
That last skill — the self-check — is underused in most data resources, but it teaches students something worth naming explicitly: organized data should be internally consistent. A second grader who notices that her tally totals add up to 19 when the data set had 20 items has just caught her own error. That is mathematical reasoning, not just counting.
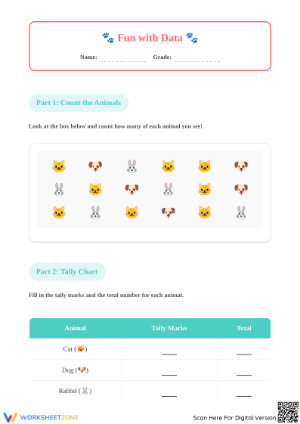
The Two-Step Move: Tally Marks into Frequency Tables
Second graders arrive at data organization with solid one-to-one counting skills, but they haven't yet internalized the idea that a mark can represent a count, and a numeral can represent a collection of marks. Tally charts are the bridge. The five-group convention links directly to the skip-counting by fives students have been practicing since first grade, so the cognitive connection is already in place. These worksheets honor that sequence: students tally first, then total, then record in the frequency table. The two-step process keeps cognitive load manageable and makes the relationship between raw counting and summarized data visible — a student can trace the exact path from an original item to the final numeral.
The worksheets also stay within four categories, the limit specified by 2.MD.D.10, and that constraint turns out to be pedagogically sound. Four categories means students can hold the whole data picture in working memory while they count. When you push past four categories with second graders, accuracy drops — not because the math is harder but because the tracking demand increases. Keeping the category count capped lets students focus on accuracy and reasoning rather than managing sheer volume.
Mistakes Students Make That These Worksheets Surface
The most common error isn't miscounting — it's skipping items. Students will tally every third or fourth object, assuming they've covered all of them, when they haven't. What you'll see in their work is a frequency table that totals to 16 when the data set had 20 items, and when you ask the student to show you how she counted, she'll often point to the data without any systematic left-to-right or top-to-bottom path. The self-check prompt on these worksheets draws attention to the discrepancy before the student moves on.
A second pattern: students correctly group tally marks in sets of five but then recount each individual mark instead of skip-counting the bundles. So a tally showing three groups of five and two individual marks gets laboriously recounted as 1, 2, 3... 17. They've done the grouping correctly but bypassed the efficiency it was supposed to provide. That distinction — count the bundles first, then add the extras — is worth a brief whole-class discussion during the first lesson where you introduce these worksheets.
A third error shows up specifically in the comparison questions: students confuse "how many more" with "how many in total." If nine students prefer dogs and five prefer cats, a surprising number of second graders will write 14 instead of 4. The phrasing trips them up consistently. The word problems on these worksheets use stable, predictable language that you can reference directly when reteaching that distinction.
How to Build These Worksheets Into Your Lesson Plans
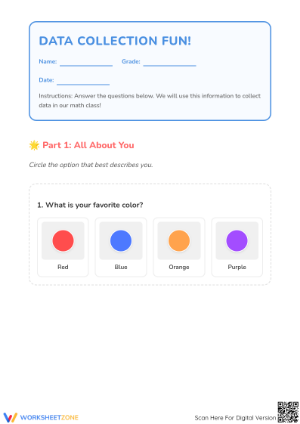
The most effective entry point for organizing data worksheets printable for 2nd grade is right after the hands-on collection phase of a data lesson. Do the physical survey — a show of hands, a class vote on favorite recess activities — and record the raw results on the board. Then send students to their seats with a worksheet that mirrors that structure. The real-world data you collected five minutes ago gives them a mental model for what the worksheet data represents, which reduces confusion and keeps the counting grounded in something concrete.
For math centers, these worksheets work well as a two-round station. In round one, a pair of students completes a worksheet independently. In round two, they compare their frequency tables. If the totals don't match, they return to the raw data together to find the discrepancy. That comparison step catches errors without requiring teacher intervention — which matters when you're running three other center groups simultaneously.
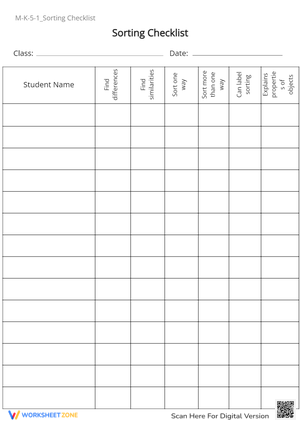
For formative assessment, a completed worksheet tells you more than a quiz does. If a student's tally marks are correct but her frequency table totals are wrong, she understands data recording but is making arithmetic errors. If the tally marks themselves are inconsistent — some items tallied multiple times, others skipped entirely — she hasn't developed a systematic approach to the counting process yet. The worksheet gives you evidence at each step of the sequence, not just at the final answer.
Standard Alignment
CCSS.MATH.CONTENT.2.MD.D.10 — Draw a picture graph and a bar graph (with single-unit scale) to represent a data set with up to four categories. Solve simple put-together, take-apart, and compare problems using information presented in a bar graph.
These worksheets address the front end of that standard — the organization and categorization work that must happen before graph construction begins. Students who skip directly to graphing often produce bars with inconsistent heights or misaligned picture representations because they never accurately tallied the underlying data. Using this set as a prerequisite to graphing activities gives students a frequency table they can trust as the source for their bar heights and category labels. The graph becomes a representation of something real rather than an approximation.
Adjusting the Worksheets for a Range of Learners
For students who are still developing counting accuracy, reduce the data set size before assigning the worksheet. If a worksheet asks students to tally 20 items, cross out six and tell the student to work with the first 14. The structure of the worksheet stays identical — tally chart, frequency table, comparison questions — but the volume is lower. This keeps the student working through the full skill sequence without the frustration of losing track midway through a large count.
For students who move quickly through the set, add a layer: ask them to write their own "how many more" question using the data they just organized, then swap with a partner to solve it. This pushes into problem-posing territory, which surfaces whether a student truly understands comparison or simply answered the questions already printed on the worksheet. The difference between those two things matters more than a correct answer alone shows.
Students who struggle specifically with category-sorting — identifying whether an item belongs in one group or another when attributes overlap — benefit from talking through the sorting decision out loud before they start tallying. A quick verbal explanation ("I'm putting this here because it has three sides") makes the categorization logic visible, both to the teacher and to the student herself. Organizing data worksheets printable for 2nd grade that include a short category-decision prompt at the top of each worksheet support this process without slowing down students who don't need it.
Frequently Asked Questions
What's the right moment in a data unit to introduce these worksheets?
After students have done at least one hands-on data collection activity — a class survey, a manipulative sort — and have seen what raw, unorganized data looks like. Starting cold, without that concrete experience, tends to produce mechanical mark-making rather than genuine understanding of what is being organized and why.
My students already know how to make tally marks. Are these still worth assigning?
Tally-mark familiarity doesn't automatically transfer to systematic data organization. Students can make tally marks on a blank page and still struggle when they need to sort incoming data into labeled categories, track which items they've already counted, and convert tally groups to frequency totals — all in sequence. These organizing data worksheets printable for 2nd grade practice that full sequence, not just the marks themselves.
How do these worksheets connect to bar graphs and picture graphs?
They feed directly into graphing. A completed frequency table is the exact input a student needs to draw an accurate bar graph — category labels along one axis, numerical totals determining bar height. Students who have practiced translating raw data into a frequency table make noticeably fewer scaling and labeling errors when they move to graphing. Each worksheet functions as rehearsal for the graph construction that follows.
Can these be sent home without much parent explanation?
Yes. The tally chart and frequency table format is straightforward once students have encountered it in class. Each worksheet includes pre-labeled categories and pre-formatted columns, so a parent doesn't need to understand the lesson context to help at the kitchen table. The comparison questions are worded plainly enough that most families can read and discuss them without additional guidance.