These organizing data worksheets pdf for 1st grade give teachers ready-to-use practice across the three core data moves first graders need: sorting observations into categories, recording counts with tally marks and simple pictographs, and answering comparison questions about what they've built. The set works without manipulatives, making each worksheet a reliable choice for independent centers, homework packets, or substitute-day folders.
The Three Data Skills Each Worksheet Targets
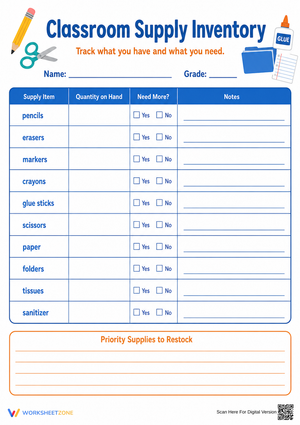
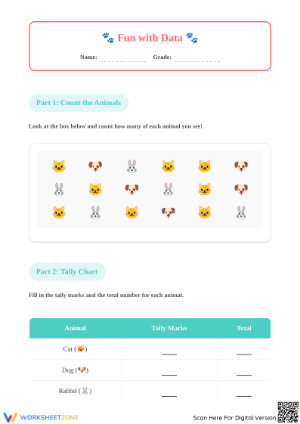
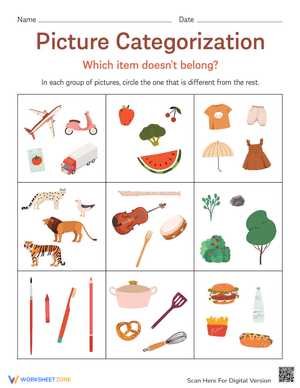
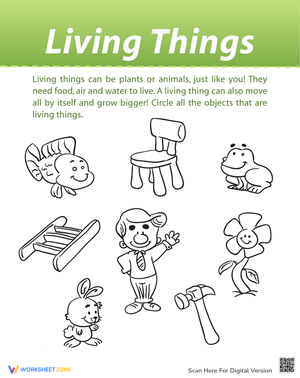
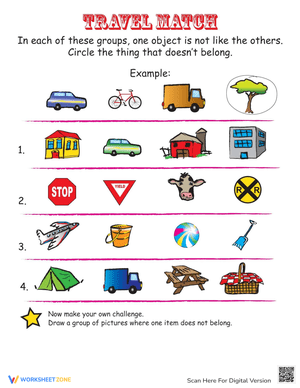
Tally charts come first in the progression, and rightly so. Drawing a diagonal slash across four vertical marks asks a student to think in groups of five — a grouping concept that precedes formal skip-counting but plants the same root. Each worksheet in the tally section presents a sorting scenario: classroom supplies grouped by type, weather symbols counted across a calendar strip, animals sorted into habitat categories. Students mark each item, total the bundles, and record the count. That physical connection between drawing and counting is the whole point before bar graphs enter the picture.
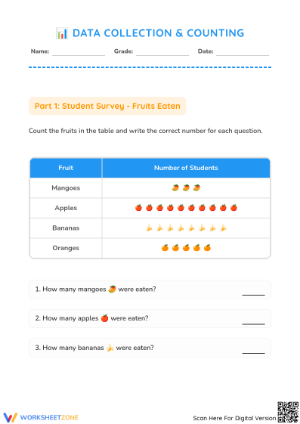
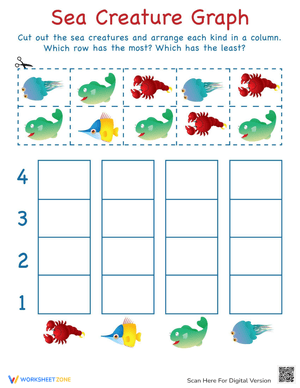
Pictographs follow, and these worksheets hold strictly to one-to-one correspondence — one icon, one item. Scaled pictographs, where each symbol represents two or five units, belong in third grade; introducing that convention here splits a student's attention between reading the graph and managing a multiplier they are not ready for. Keeping it one-to-one lets students concentrate on the structure itself: categories in rows or columns, icons lined up for direct comparison.
Bar graphs close the sequence. Students color cells on a pre-drawn grid or draw bars based on a tally chart completed on the same worksheet. The interpretation questions that follow — Which category has the fewest? and How many more were in group A than group B? — require reading the graph and computing a difference, which is the cognitive move the standard actually assesses.
Standard Alignment
CCSS.MATH.CONTENT.1.MD.C.4 asks first graders to organize, represent, and interpret data with up to three categories — including questions about totals, individual counts, and the difference between categories. That last part is the hardest, and it is the piece most programs underassess. Organizing data worksheets pdf for 1st grade that present all three question types at the bottom of each bar graph give teachers direct formative evidence on where a student sits within the standard, not just whether they can fill in a tally chart.
The Errors That Show Up Most Reliably in Student Work
The most persistent error is not in the tallying — it is in the comparison question. A student who correctly builds a tally chart showing 4 sunny days, 3 cloudy days, and 2 rainy days will often answer "How many more sunny days than rainy days?" by writing "4." They report the larger number rather than finding the difference. They are retrieving, not comparing. The correction that works: have students cross off one sunny mark for each rainy mark, leaving unmatched marks visible, then count what remains. Making the difference physical before making it numerical fixes this for most students in one or two tries.
A second error surfaces specifically with tally marks. Students who have not internalized groups of five draw the diagonal slash too early or skip it entirely, producing bundles of four or six that they cannot recount accurately. This is not a careless mistake — it signals that the five-group concept the tally system depends on has not yet taken hold. Before handing a tallying worksheet to those students, a two-minute rehearsal with five physical objects (cubes lined up on a desk, fingers raised) stabilizes the concept enough for the written version to land.
How to Fit These Worksheets Into Your Math Block
The most productive slot is the last eight to ten minutes of math after whole-group data collection has already happened. Gather data together first — survey students on how they get to school or which book character they would want as a friend, mark the answers on the board — then hand out the worksheet and ask students to record and graph what the class just produced. The transfer from shared whiteboard data to individual worksheet is where the concept solidifies, because students already know what the graph should show and can self-check as they build it.
Organizing data worksheets pdf for 1st grade also slot naturally into Monday warm-ups following morning meeting. If morning meeting includes a daily question, students can tally responses during the transition to math and carry those numbers directly into a worksheet. The data becomes real — it came from the people in the room — and that shift turns the work from an abstract exercise into a record of something that actually happened.
Making These Worksheets Work Across the Full Ability Range
Students still building fine motor control can be given pre-completed tally marks to circle into bundles of five rather than drawing each mark from scratch. This keeps the cognitive focus on counting and categorizing instead of stalling the lesson because a student's pencil grip is not yet reliable. On the other end, students who move through the printed questions quickly can write a second comparison question of their own, which pushes them into the generative side of data analysis rather than just the receptive side.
Organizing data worksheets pdf for 1st grade that include pre-labeled axes and numbered gridlines remove the orientation confusion that trips up students who struggle with unlabeled grids. The perceptual load of figuring out where to begin drops, and so does the error rate on bar graphs — specifically, coloring one cell too many or too few. For those students, a labeled grid makes the interpretation questions a realistic next step rather than a distant one.
Frequently Asked Questions
Can these worksheets serve as a formal assessment of 1.MD.C.4?
They work well for both formative and summative purposes. A completed tally chart shows whether a student has one-to-one correspondence and can group by fives. A completed bar graph shows whether they can translate a count into a visual representation. The interpretation questions at the bottom assess the comparison reasoning the standard explicitly names. A single worksheet can yield evidence on all three parts of 1.MD.C.4 at once, which is more diagnostic than most end-of-unit tests manage.
How many categories should a first-grade data activity include?
Three is the ceiling the Common Core standard sets, and it is the developmentally appropriate one. Two categories let students practice "more or less" but eliminate the middle value, where some of the most useful classroom conversation happens — it was not the most and it was not the least, so how do we describe it? Four or more categories push fine motor and tracking demands past what most first graders can handle without losing accuracy during the tally stage.
What is the best way to introduce tally marks before students use a tallying worksheet?
Start with five physical objects — popsicle sticks work well. Have students arrange four upright and place the fifth across them. Ask them to explain why the fifth stick goes sideways before moving to paper. Students who can articulate "it holds the bundle together" draw tally marks correctly on the worksheet. Students who skip the physical stage and go straight to pencil frequently produce unbundled strings of six or seven marks that they later miscount, and correcting that habit mid-worksheet is harder than preventing it with two minutes of concrete work first.