These 1st grade statistics worksheets printable give first graders structured, repeated practice with tally marks, pictographs, and simple bar graphs — the three data representations required under CCSS 1.MD.C.4 by year's end. Each worksheet isolates a specific task: recording classroom counts using tallies, completing an unfinished pictograph from a data set, coloring in a bar graph grid, or answering "how many more" comparison questions drawn from a completed chart. Teachers get a set they can use sequentially during a statistics unit or pull from individually during review.
What Each Worksheet Targets
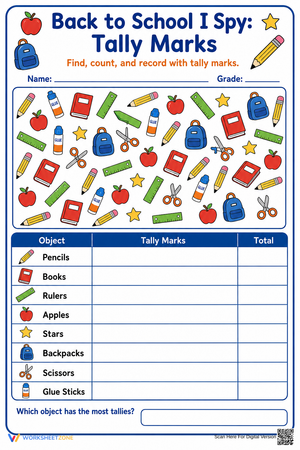
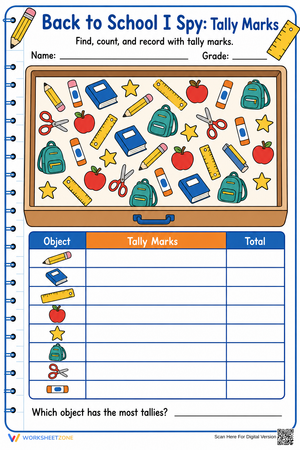
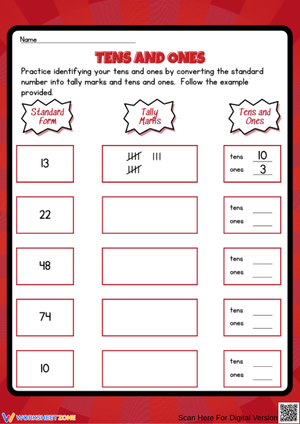
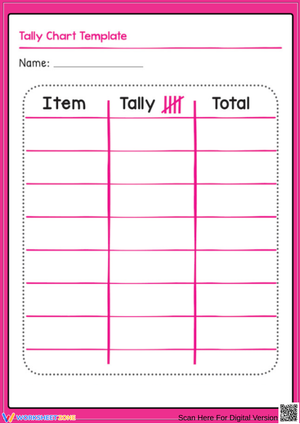
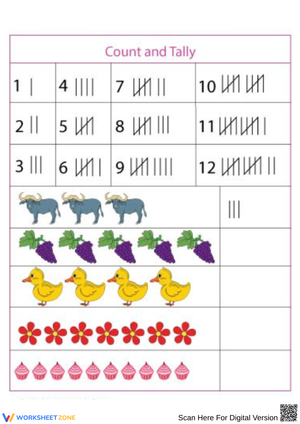
Across the 1st grade statistics worksheets printable in this set, tally mark exercises ask students to examine sorted groups of objects — weather symbols, animal pictures, shape collections — and record the count for each category. The progression moves from two categories with totals under 10 toward three categories approaching 20, which is precisely where the five-group bundling becomes genuinely useful rather than an arbitrary convention. Students also practice reading completed tally charts, which is a distinct skill from recording and one that classroom instruction tends to underemphasize.
Pictograph worksheets keep the scale at 1:1, with each icon representing one student response. This matters developmentally: first graders are still consolidating one-to-one correspondence, and a scale where "each picture = 2" introduces a multiplicative layer that obscures what graphing is actually for. Students complete partial pictographs, construct their own from a tally chart, and answer questions about totals and category comparisons.
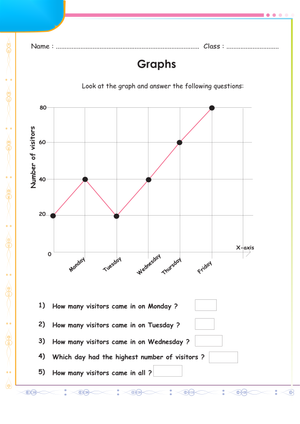
Bar graph worksheets follow the same 1:1 logic on a clearly labeled grid. Students shade boxes to represent category totals, then answer a series of interpretive questions about the completed graph. The final worksheets in the set present pre-built graphs with no drawing task — only reading and comparison questions — which isolates the interpretive skill and often surfaces students who produce neat graphs but cannot yet extract meaning from them.
Standard Alignment
CCSS.MATH.CONTENT.1.MD.C.4 asks first graders to organize, represent, and interpret data with up to three categories. The standard explicitly requires students to answer questions about the total number of data points, how many fall in each category, and how many more or fewer appear in one category compared to another. That third requirement is where 1.MD.C.4 becomes genuinely demanding for six-year-olds: it calls for applying subtraction to a visual context rather than a written equation. The worksheets address all three layers of the standard — recording, reading, and comparing — rather than stopping at the graphing portions that are easiest to check at a glance.
Errors Students Make That These Worksheets Help You Catch
The most consistent tally mark problem is what might be called the sixth-mark error: a student draws four vertical lines, adds the diagonal for the fifth, and continues to a sixth mark before stopping — because they are tracking the physical motion rather than counting a completed group. It surfaces most often when students are tallying fast-moving data, like classmates raising hands. Teachers who know to watch for it can intervene in the moment rather than seeing it baked into a completed worksheet.
On pictograph exercises, students reliably misread questions about a specific category by counting every icon on the entire chart. This is a directionality issue: they understand the question in the abstract but have not yet learned to track a single row with a finger before counting. A simple prompt to underline the category name and drag a finger along that row eliminates the error for most students immediately.
The comparison question — "how many more students chose dogs than fish?" — produces a particular error even in students who draw clean graphs. They find the correct difference but assign it to the wrong category, claiming the smaller group has "more." This reads like a subtraction mistake, but it is a language issue: "how many more" and "how many fewer" require understanding directionality in the comparison, not just the arithmetic. Watching which phrasing triggers the error tells you more about each student's statistical reasoning than a final answer alone does.
Fitting These Worksheets Into Your Teaching Week
The tally mark worksheets work well as morning warm-ups paired with a live class survey. "Did you eat a hot breakfast or a cold one today?" takes 90 seconds to collect and gives students real data to translate into marks immediately. That direct connection — raised hand to tally mark to chart — does more to establish what tallying is for than any pre-printed example set can.
Bar graph and pictograph worksheets fit naturally into center rotations. While the teacher works with a small group on comparison questions, students at an independent center work through a graphing worksheet without needing to interrupt. These worksheets are self-contained — students have every data set and label they need right there — so the format holds up without adult support. The comparison question worksheets, which require more interpretive judgment, work better as a closing discussion task than pure silent independent work.
These 1st grade statistics worksheets printable also serve as a compact summative tool at the end of the unit. One worksheet covering all three question types — recording, reading, comparing — gives teachers a clear picture of where each student stands across the full standard in roughly 10 minutes of class time.
Adapting the Set for Different Student Levels
Students still developing number sense below 10 work the two-category tally worksheets more successfully when they first count physical objects into two groups and keep those counters visible on the desk. This keeps their cognitive load on the statistical task — categorizing and recording — rather than on basic counting. Removing the counters once they demonstrate accuracy lets you watch for the moment the abstract representation holds on its own.
Students who have already mastered two-category graphs and read numbers reliably past 20 can extend any bar graph worksheet by sketching a fourth category in the margin and generating their own data to fill it. They can also write their own comparison questions for a completed graph and exchange them with a partner, which demands the same interpretive understanding as answering questions but forces them to think from the question-writer's perspective.
For students who need a second pass after the unit closes, 1st grade statistics worksheets printable work as a low-prep spaced retrieval tool. A single bar graph worksheet assigned six weeks after the unit ends takes five minutes and surfaces any regression in comparison-question fluency before it compounds into a gap in second grade.
Frequently Asked Questions
How many categories should first-grade graphs include?
Two to three categories is the expectation under 1.MD.C.4. Three is the practical ceiling for most first graders — not because the drawing mechanics change, but because comparison questions across three categories require holding more values in working memory at once. Introduce the third category only after students answer two-category comparison questions with consistent accuracy.
What survey questions work well for collecting class data?
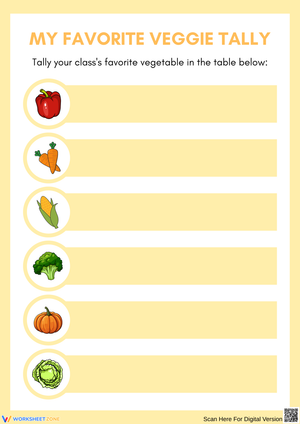
Questions with mutually exclusive answers and no more than three likely responses produce the cleanest data. "What is your favorite season?" tends to split across four near-equal categories in a class of 20, which muddies the comparison questions. "Do you prefer apples, bananas, or grapes?" gives students a bounded choice set and typically produces one clear winner — easier to anchor interpretation discussions around a concrete result. Questions involving food, pets, or weekend routines draw more genuine engagement than purely academic prompts.
When during the year should this unit run?
Most first-grade pacing guides place statistics in the second half of the year, after students have consolidated counting to 20 and have some exposure to addition and subtraction within 10. That sequence matters because the comparison questions require subtraction. Teaching the unit before students can reliably subtract within 10 means they rely on counting-up strategies for every comparison question, which works but is slower and more error-prone than it needs to be.
Can these worksheets serve students outside of first grade?
The tally mark and pictograph worksheets function as review for second graders transitioning to scaled graphs, because they reinforce the 1:1 baseline before the scale changes. For kindergartners, the two-category tally worksheets are accessible if students are solid on one-to-one correspondence and number recognition to 10, but comparison questions will need to be read aloud and discussed rather than completed independently.