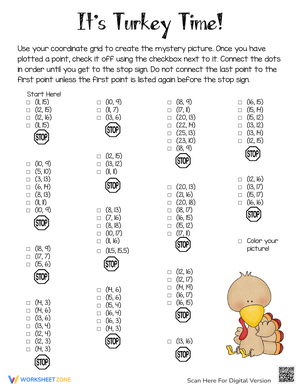
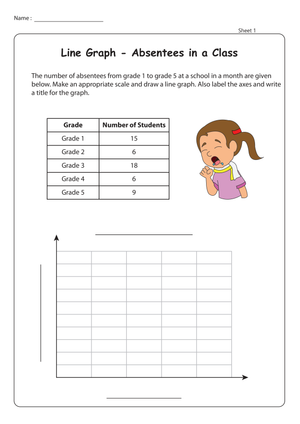
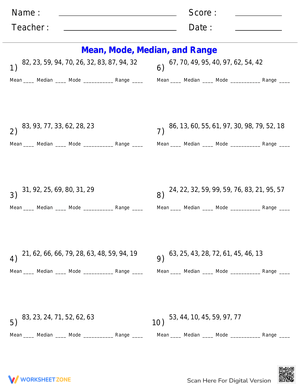
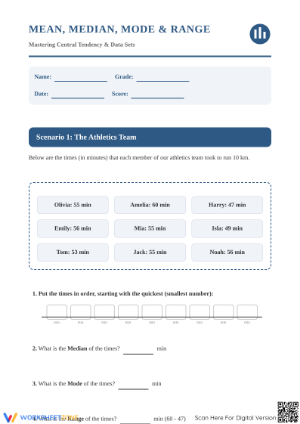
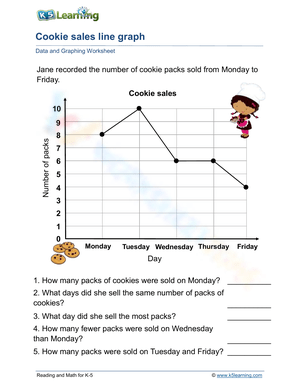
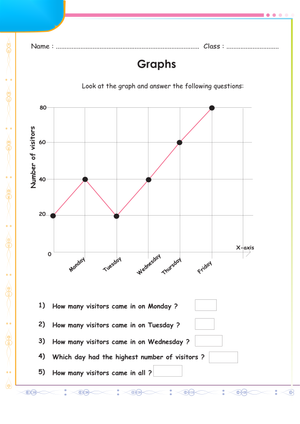
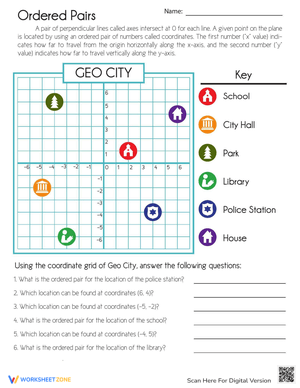
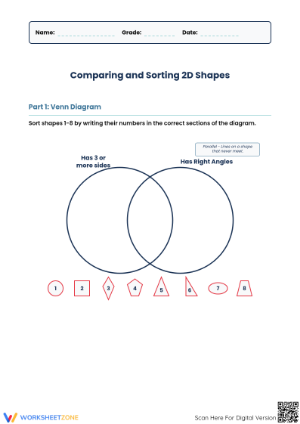
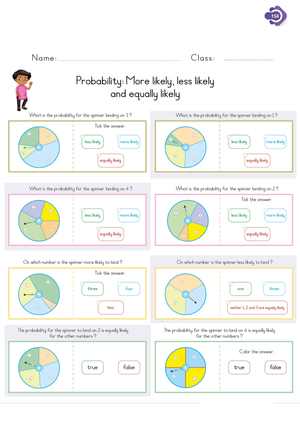
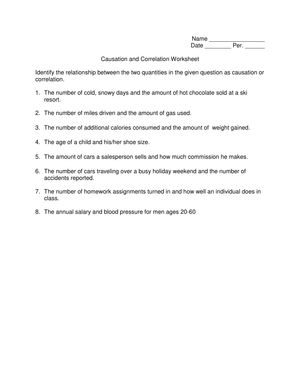
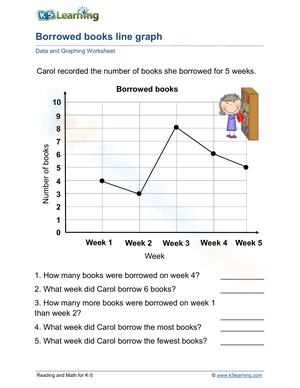
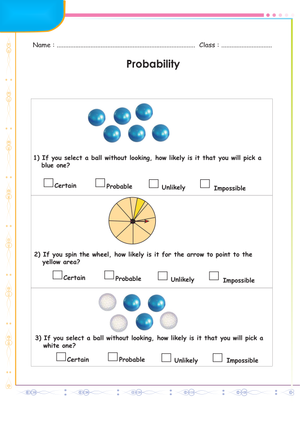
These 4th grade data and graphing printable worksheets move students through the full arc of the skill—from answering questions about a pre-built bar graph to constructing a line plot from raw measurement data and drawing conclusions from what they made. The set covers bar graphs, pictographs, line plots with fractional measurements, frequency tables, and basic circle graphs, with enough range to support instruction from a first introduction through the review that closes a unit.
The Specific Skills Targeted
Each worksheet addresses a distinct skill within the data strand, so teachers assign by need rather than working through everything in sequence. The coverage includes:
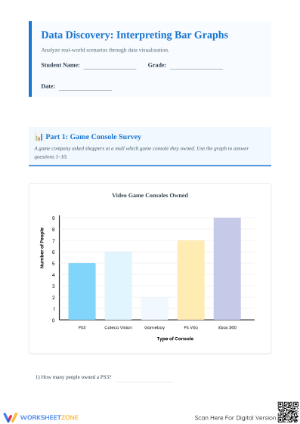
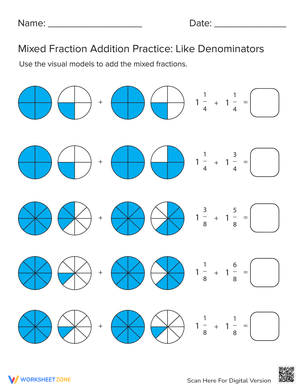
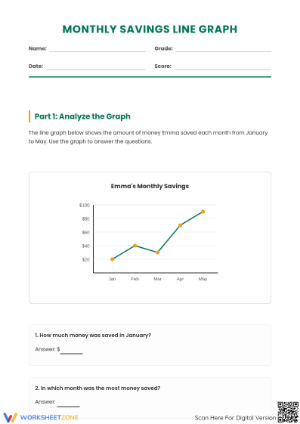
- Bar graphs: Reading single and double bar graphs, comparing categories, and solving multi-step questions that require more than a simple look-up of displayed values.
- Pictographs: Interpreting symbol keys, calculating totals when each symbol represents more than one unit, and comparing groups across categories using the key.
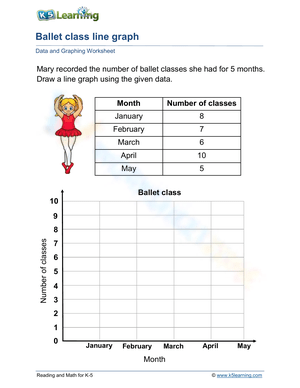
- Line plots: Building and reading line plots that display measurement data in fractions of a unit—halves, fourths, and eighths—then solving fraction addition and subtraction problems drawn directly from the plot.
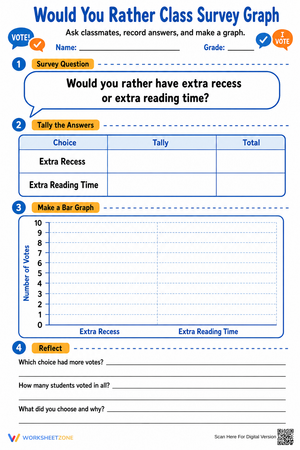
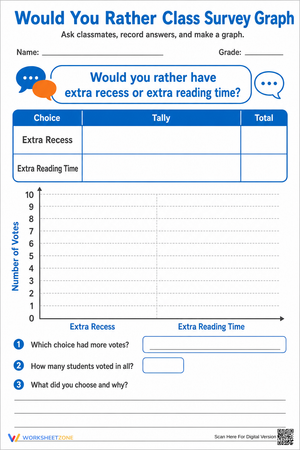
- Frequency tables: Recording raw data using tally marks and frequency counts before transferring the organized information to a completed graph.
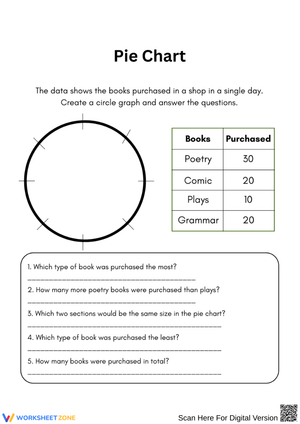
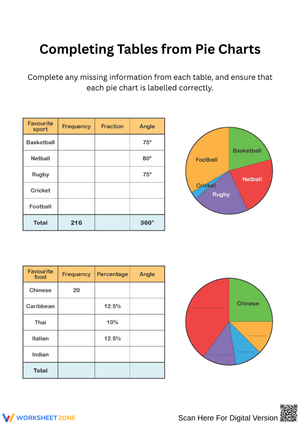
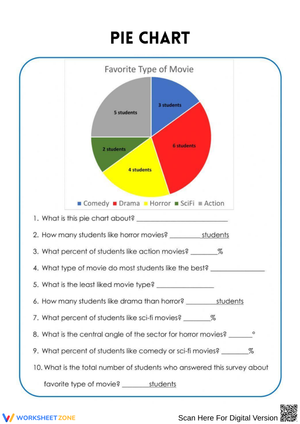
- Circle graphs: Reading basic pie charts and reasoning about how individual sections relate to the whole.
- Data interpretation: Answering open-ended questions that ask students to compare data sets, identify trends, and write a sentence explaining what the data shows.
The standards expect more than reading fluency. By the end of a unit, students need to select an appropriate format for a given data set, build the graph from scratch, and explain what the data reveals. Each worksheet targets a specific point along that progression.
Line Plots and the Fraction Connection at Grade 4
The line plot with fractional measurements sits at the intersection of two major fourth-grade domains: measurement and fractions. Students record measurements in fractional units, plot them on a number line divided into halves, fourths, or eighths, and then add or subtract the values to answer questions about the data. A student who cannot place three-eighths accurately on a number line carries that difficulty directly into the graphing task — the two skills are not separable here the way they sometimes appear in isolation on a skills checklist.
One classroom routine that consistently strengthens retention: have students measure their pencils to the nearest quarter inch, collect the class results, and build a shared line plot on the board before anyone works independently. Once the construction process is visible and tied to real objects in the room, the individual worksheet feels like documentation of something already understood rather than a new procedure to decode. The fraction computation that follows — finding the difference between the longest and shortest pencil, or summing all lengths marked at three-fourths — lands with more accuracy when students can picture what the fractions represent.
Student Error Patterns Worth Anticipating Before the Lesson
Pictograph keys generate a predictable breakdown. A student who correctly multiplies four symbols by five will often read a half-symbol as 2.5 and round arbitrarily to 2 or 3, skipping any mathematical reasoning behind the choice. When reviewing pictograph worksheets, look for suspiciously round totals in categories that display half-symbols — that pattern almost always signals this shortcut rather than a standard calculation mistake.
On line plots with fractional measurements, the most common problem is mark placement rather than computation. Students plot three-fourths and one-half in the same general region when the number line lacks clearly marked intervals, or when they haven't internalized the relative size of each fraction. A student who misplaces a mark but then computes correctly has a fraction understanding problem; one who places the mark correctly but makes an arithmetic error has a computation problem. The worksheet distinguishes the two, which makes re-teaching decisions more precise than a simple right-or-wrong score would suggest.
Planning Strategies for Building These Worksheets Into Your Week
The most flexible use of 4th grade data and graphing printable worksheets is as bell-ringers. Project a graph on the board, ask two or three focused questions, and students re-engage with the content before the lesson formally begins — the whole routine takes under five minutes and works especially well on Monday mornings when students need a low-stakes re-entry into math. It also surfaces quickly which students retained the previous lesson and which need a short review before new material is introduced.
Math centers work well with different graph formats assigned to different stations — bar graphs at one, line plots at another, pictographs at a third — letting students rotate through all three within a single class period. Each worksheet is self-contained with no ordering constraint, which removes the pacing problem that comes with whole-class instruction on a skill some students have already internalized. For exit tickets, the shorter interpretation worksheets fit into the last eight minutes before dismissal and give a sharper read of understanding than a show-of-hands check. A sorted stack of responses — those who answered both questions correctly, those who missed one, those who missed both — tells exactly who needs re-teaching before the next lesson.
Standard Alignment
The most directly supported standard across this set is 4.MD.B.4, which requires students to make line plots to display data recorded in fractions of a unit (one-half, one-fourth, one-eighth) and use those plots to solve fraction addition and subtraction problems. Most pacing guides place this standard toward the end of fourth grade because it depends on fraction understanding that develops across the year. Teachers who introduce it too early often find students can build the line plot correctly but cannot complete the computation that follows — the worksheets that separate the construction step from the calculation step are the ones to reach for in that situation.
Bar graph and pictograph work connects to the broader 4.MD measurement domain and to 4.OA through the multi-step word problems embedded in many interpretation questions. A student answering "how many more students preferred soccer than basketball" is applying subtraction within a real-world context, meeting both standards in a single short task. Using 4th grade data and graphing printable worksheets as embedded arithmetic practice — not only as graphing practice — gets more instructional return from the same amount of class time.
Differentiating Across Student Levels With This Set
For students still developing fluency with whole-number operations, bar graph and frequency table worksheets are the right entry points. Those formats keep the computational demand lower while still requiring students to reason about data — comparing categories, reading scales, answering multi-step questions. 4th grade data and graphing printable worksheets that ask students to read a completed graph rather than build one from raw data work well as a first exposure for students who need more time with the concepts before taking on construction tasks.
Students ready for additional challenge benefit from worksheets that require constructing a graph from a raw data table, writing a conclusion sentence, and then generating a follow-up question the data could answer. That last step — producing a new question rather than answering someone else's — is a reliable indicator of genuine conceptual understanding rather than procedural completion, and it costs no additional prep time to assign. For students who freeze when an unfamiliar graph format appears, a brief teacher prompt before independent practice — "look at the key first; tell me what one symbol equals" — prevents stuck-at-the-start paralysis without restructuring the entire task.
Frequently Asked Questions
What graph types are fourth graders expected to work with at this level?
Fourth graders are expected to read and create bar graphs, pictographs, and line plots with fractional measurements. Frequency tables and basic circle graphs appear in most Grade 4 curricula as well. The clearest standards emphasis falls on line plots under 4.MD.B.4, but students also need real familiarity with each format — not just exposure to it — because the standards expect them to select an appropriate graph type when given raw data and a choice of representations.
How do line plots connect to Grade 4 fraction standards?
Standard 4.MD.B.4 places line plots at the exact meeting point of measurement and fraction work. Students record measurements in fractional units, mark them on a number line divided into halves, fourths, or eighths, and then solve problems by adding and subtracting the values displayed. This makes every line plot worksheet double-duty practice: students reinforce fraction number sense each time they read or build the graph, not only when they work on a standalone fraction activity.
How should I sequence these worksheets across a data unit?
A reliable sequence moves through three stages: reading (students answer questions about a completed graph), creating (students build a graph from a raw data table), and analyzing (students compare two data sets or write a conclusion in their own words). Working through that arc within each graph format keeps cognitive demand progressively higher. Line plots with fractional measurements belong at the end of the unit, after fraction addition and subtraction have been formally introduced and students have had enough practice that the computation doesn't overwhelm the graphing work.













 Interactive Worksheet Maker
 Quiz Maker
 Word Search Maker
 Crossword Puzzle Maker
 Word Scramble Generator
 Sentence Scramble Generator
 Handwriting Worksheet Generator
 Name Tracing Generator
 Fill In The Blank Generator