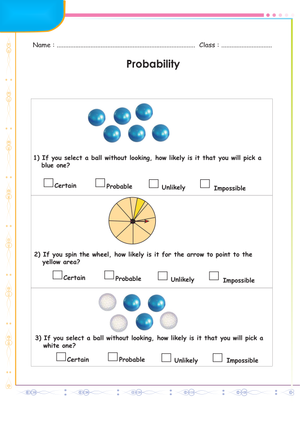
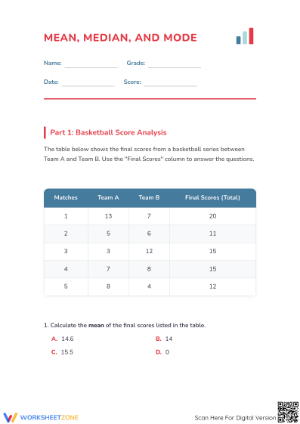
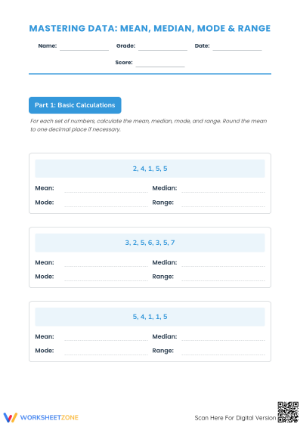
These 4th grade statistics pdf worksheets give teachers print-ready practice for the full Grade 4 data strand — line plots with fractional measurements, bar graphs with multi-unit scales, pictographs, and the introductory statistical landmarks most fourth-grade curricula introduce before students leave elementary school. Each worksheet targets the specific places where student understanding tends to break down: accurately reading a double bar graph, plotting measurements in halves, quarters, and eighths on a number line, and pulling the right values from a graph to solve a multi-step problem.
Skills These Worksheets Build
The most technically demanding skill at this level is the fractional line plot. Students mark measurement data — often lengths or capacities recorded to the nearest quarter or eighth of a unit — above a pre-drawn number line, then answer questions that require adding or subtracting those fractional values. This is where data skills and fraction arithmetic meet directly, and it is where students need the most deliberate repetition.
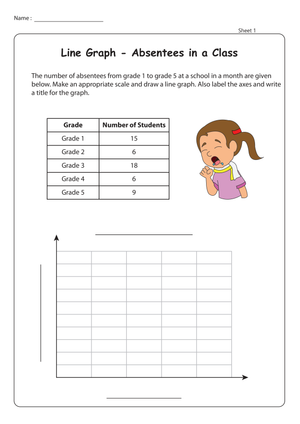
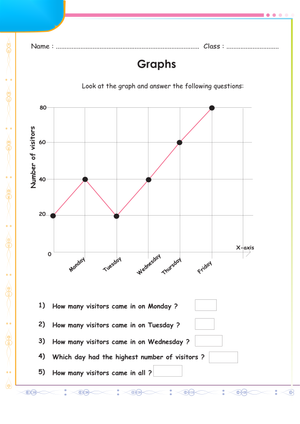
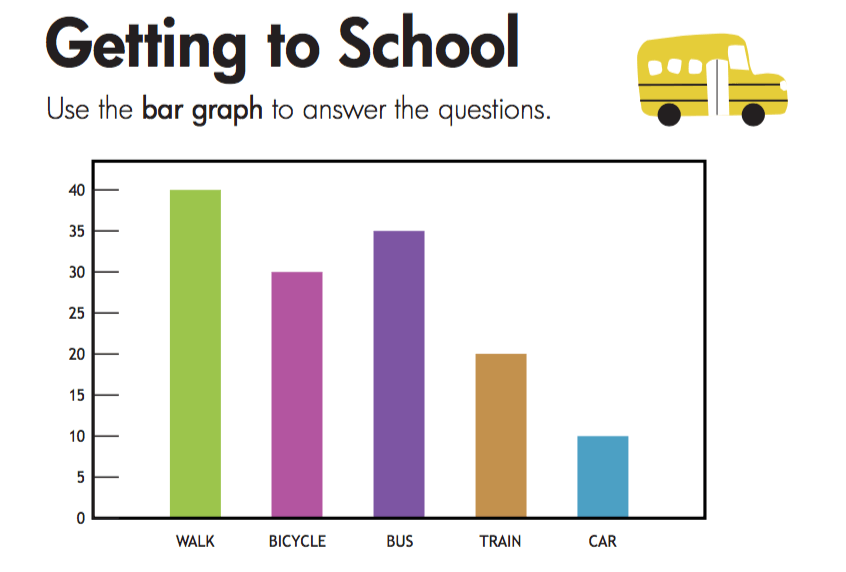
Bar graph and pictograph worksheets move students through three progressively harder tasks: reading values from a completed graph, finishing a partially built graph using a data table, and constructing a graph from scratch with an appropriate scale. Double bar graphs — comparing two data sets displayed side by side — appear across several worksheets in the set. Students must read the legend carefully and distinguish between the two bars before answering any question.
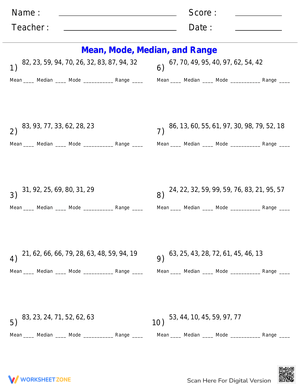
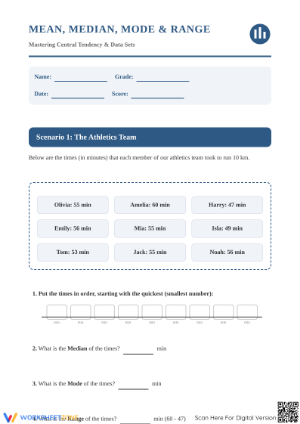
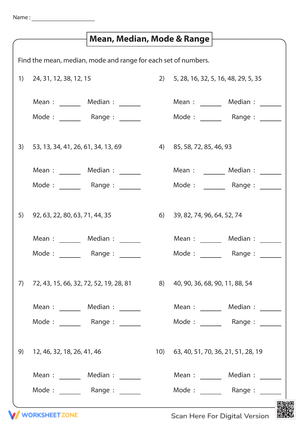
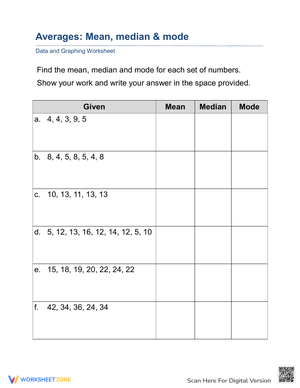
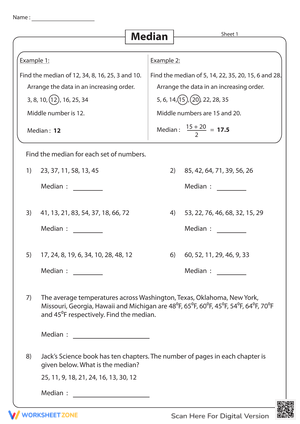
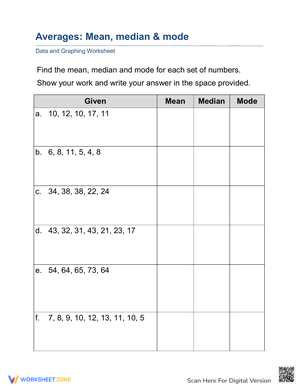
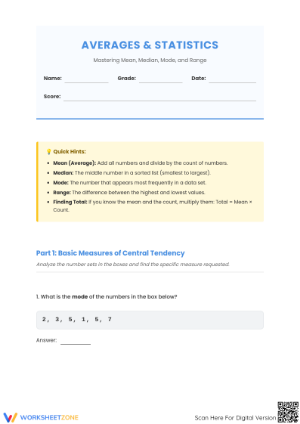
Several worksheets introduce the statistical landmarks students will use throughout upper elementary and middle school: range, mode, and median. The problems keep data sets small — typically 8 to 12 values — so the arithmetic stays manageable and students can focus on understanding what each landmark describes rather than getting lost in computation.
Mistakes Students Make That These Worksheets Help You Catch
The most predictable error on fractional line plots is tick-mark counting. A student working on a plot marked in eighths will count the seven marks between 0 and 1 and label them 1/7, 2/7, 3/7 — reading the number of gaps rather than the fractional unit. The fix is to have the student name the unit fraction first (what fraction does each jump represent?) before marking any data. Catching this on a worksheet early in the unit is far better than discovering it during an assessment.
Double bar graph problems surface a different issue. When asked about one specific category, students reach for whatever bar catches their eye first — often the taller one — without checking the legend. A student asked "How many girls chose basketball?" will report the boys' value if that bar happens to be more visually prominent. Worksheets that direct students to circle the correct legend entry before answering each question slow down that reflex.
Range is routinely confused with count. Students who can define range as "the spread of the data" will still write down the total number of values in the data set, because counting is the more practiced habit. A quick diagnostic: after a student records a range answer, ask them to point to the two numbers they subtracted. If they cannot identify two specific values, they guessed.
Fitting These Worksheets Into Your Week
The 8 to 10 minutes before the class transitions to lunch is one of the most reliable spots for a graph-interpretation warm-up. Display one question from a bar graph or line plot worksheet, have students write their answer independently, then do a quick share-out. Rotating the format — pictograph on Monday, double bar graph on Wednesday, line plot on Friday — means students encounter every display type regularly throughout the unit rather than only at introduction.
Math stations work especially well with this set. Print three or four different worksheets and set them up at separate tables: one focused on fractional line plots, one on reading double bar graphs, one on completing a graph from a data table. A fourth station — blank graph templates paired with real classroom data like shoe sizes measured to the nearest quarter inch — turns the exercise into a full data-collection cycle. Students generate authentic numbers, then build the display themselves. That sequence makes the purpose of a scale and axis label concrete in a way that pre-filled examples do not.
For small-group intervention, pull students who are mislabeling tick marks or who struggle to extract specific values from a multi-unit scale. Work through the first two problems together, modeling how to anchor on the axis before reading up to the bar or across to the data point. The written work these worksheets produce gives you a concrete artifact to review across multiple sessions and track whether the error pattern is correcting.
These 4th grade statistics pdf worksheets also make clean homework assignments for skills already taught in class. Because each worksheet states the task clearly, students can work without a parent having to re-teach the concept. Assign worksheets that review one specific graph type on take-home practice rather than mixing formats, so students consolidate what they know rather than encounter something unfamiliar without support nearby.
Standard Alignment
The anchor standard for this set is CCSS.MATH.CONTENT.4.MD.B.4 — make a line plot to display a data set of measurements in fractions of a unit (1/2, 1/4, 1/8), and solve problems involving addition and subtraction of fractions using information from line plots. In classroom terms, this standard sits at the intersection of two strands: Measurement and Data, and Number and Operations — Fractions (4.NF). Students who are still unsteady with fraction number lines will struggle with line plot construction, so the line plot worksheets in this set function both as data practice and as a low-stakes check on fraction placement readiness before any summative work.
The 4th grade statistics pdf worksheets in this set use scales built on multiples of 2, 5, and 10 — consistent with Grade 4 number fluency expectations — so the arithmetic embedded in graph reading stays within grade-level range. Key alignment points across the set include:
- 4.MD.B.4 — Fractional line plots using halves, quarters, and eighths, with multi-step fraction problems drawn from plotted data
- 4.MD broader strand — Constructing and interpreting bar graphs and pictographs with multi-unit scales, including double bar graphs
- 4.NF connection — Adding and subtracting fractions in measurement and data contexts, reinforcing the fraction strand through applied problem solving
Teachers working in states with adapted standards will find the content maps cleanly to most state-level Grade 4 data frameworks, since the core skills — fractional line plots, scale-based graphs, and basic statistical landmarks — appear across virtually all state adoptions.
Adjusting the Worksheets for a Spread of Readiness Levels
For students who are not yet solid on fraction number lines, the line plot worksheets become more accessible when you provide a completed fraction strip or reference number line before asking them to build their own. This is not about reducing the mathematical task — students still plot every data point — but it removes the added cognitive demand of constructing the number line at the same time they are learning to display data. Once they can plot correctly with the reference, remove it.
Advanced students who finish quickly have a natural extension built into any graph task: write three questions about the completed graph — one requiring a single value read-off, one requiring a comparison between two categories, and one requiring a multi-step calculation. This pushes them into the same analytical moves tested on state assessments and generates discussion questions the class can work through together the following day.
For English learners, attaching a brief reference strip to the worksheet — axis, scale, legend, data point, frequency — with a small visual next to each term reduces the vocabulary demand without changing the mathematical task. Students who are simultaneously acquiring English and learning to read statistical displays carry two unfamiliar systems at once; the reference strip addresses one of them directly.
Frequently Asked Questions
What data and statistics skills are expected at the fourth-grade level?
Fourth grade students work with line plots that include fractional measurements (halves, quarters, eighths), bar graphs and pictographs with multi-unit scales, double bar graphs comparing two data sets, and introductory statistical landmarks including range, mode, and median. They also solve multi-step addition and subtraction problems using data pulled directly from visual displays.
How is a line plot different from a line graph at this grade level?
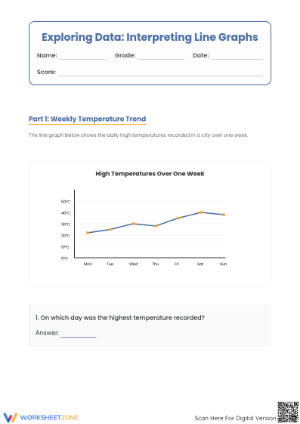
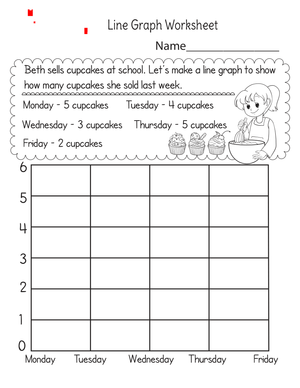
A line plot marks individual data values above a number line using Xs or dots. A line graph connects data points with line segments to show change over time. In Grade 4, line plots with fractional measurements are the primary focus under 4.MD.B.4. Line graphs appear in some curricula at this level but are developed more thoroughly in Grade 5 and beyond.
What is the best way to introduce fractional line plots to students who are not yet confident with fractions?
Review fraction placement on a number line before introducing line plots — specifically halves, quarters, and eighths between 0 and 2. Then build in a measurement step: students measure classroom objects to the nearest quarter inch and record the results. Moving from a physical measurement to a written fraction to a plotted point gives students three representations before they work independently on a worksheet. Students who skip the measurement step and go straight to plotting often have no sense of what the data values actually represent.
Can these worksheets serve as formative assessment tools?
Each of the 4th grade statistics pdf worksheets targets a specific skill or graph type, which makes the set straightforward to use as an exit ticket or quick check. A completed line plot worksheet tells you whether a student can place fractional values accurately; a bar graph interpretation worksheet surfaces scale-reading errors. Collected across a week, the set gives a clear picture of where individual students stand in the data strand before any summative assessment.













 Interactive Worksheet Maker
 Quiz Maker
 Word Search Maker
 Crossword Puzzle Maker
 Word Scramble Generator
 Sentence Scramble Generator
 Handwriting Worksheet Generator
 Name Tracing Generator
 Fill In The Blank Generator