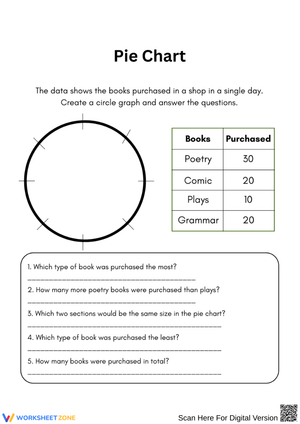
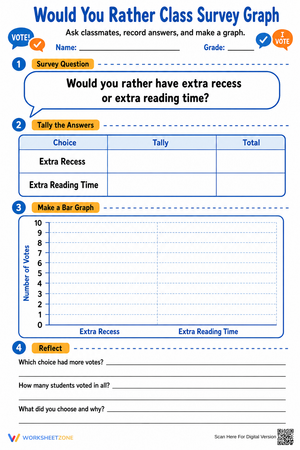
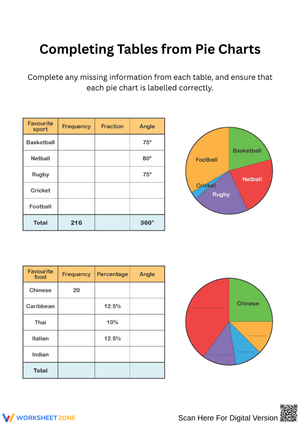
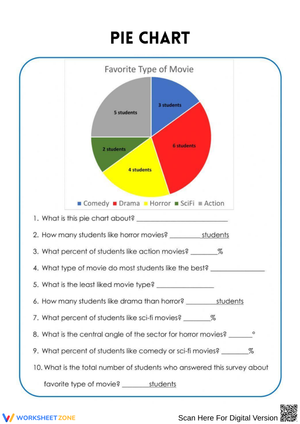
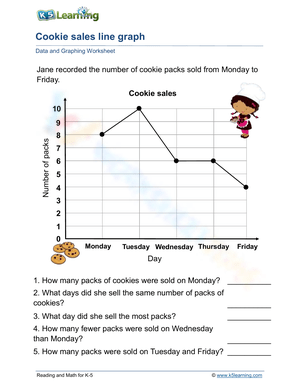
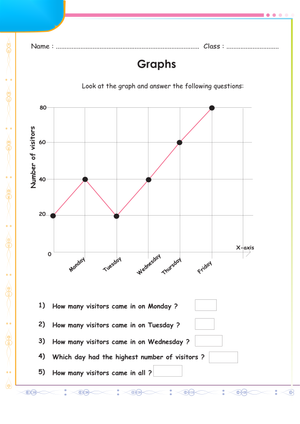
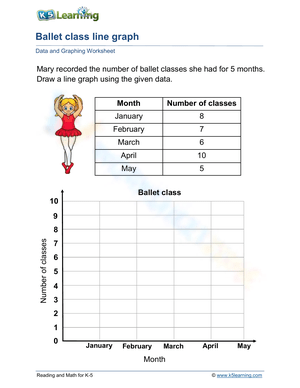
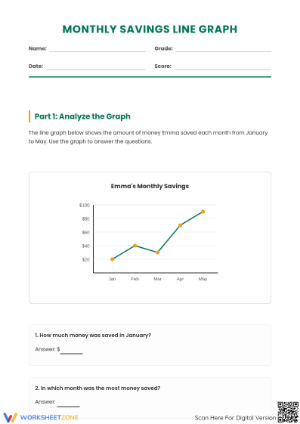
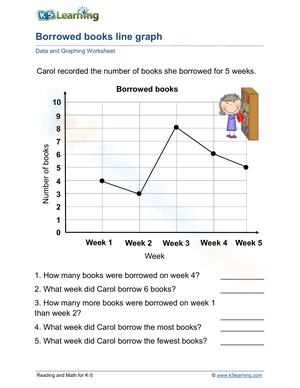
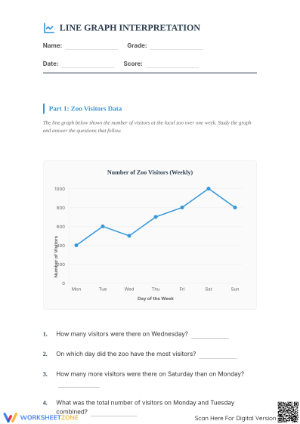
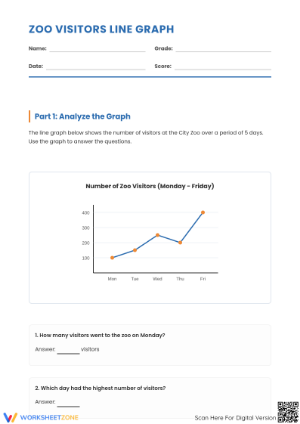
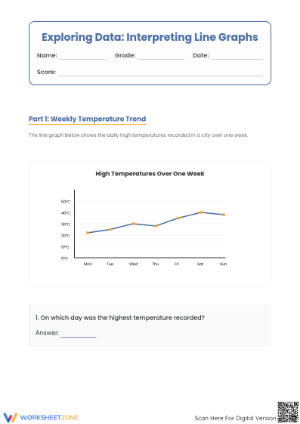
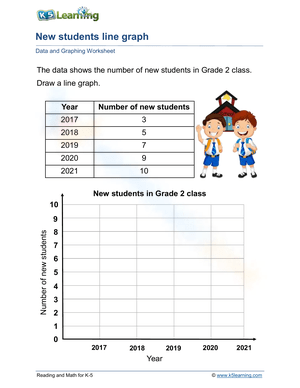
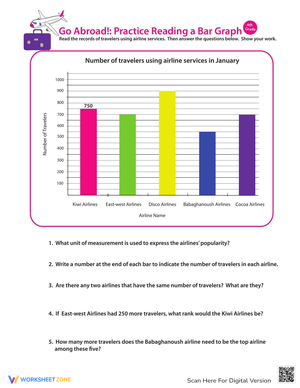
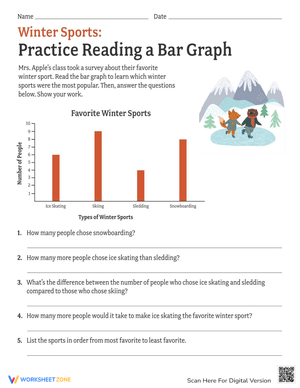
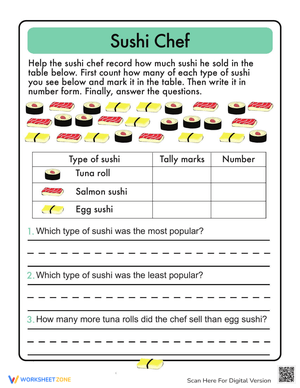
These graphing data worksheets for 4th grade address the two skills that define the Grade 4 measurement and data strand: constructing and reading line plots that include fractional measurements, and working with scaled bar graphs and pictographs where one symbol or one square represents more than a single unit. The resources move between construction tasks — where students plot their own data — and interpretation tasks, where the graph is already drawn and students answer questions from it. Both types of practice matter, and they require different thinking from students.
The Specific Skills These Worksheets Build
Line plots with fractional data sit at the center of the set. Students mark data points on a horizontal number line divided into halves, fourths, and eighths — the exact fractions named in the fourth-grade standard. Tasks begin with reading a pre-plotted line plot and answering questions, then move to plotting X marks from a provided data table. Several worksheets then ask students to add fractional values across all the marks in a given category, which is where fractional arithmetic and data work genuinely intersect.
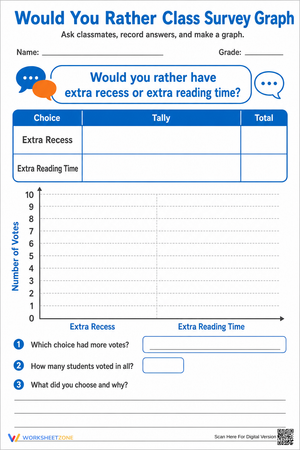
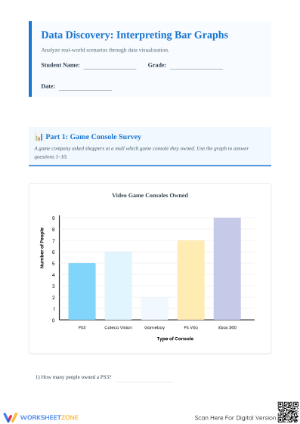
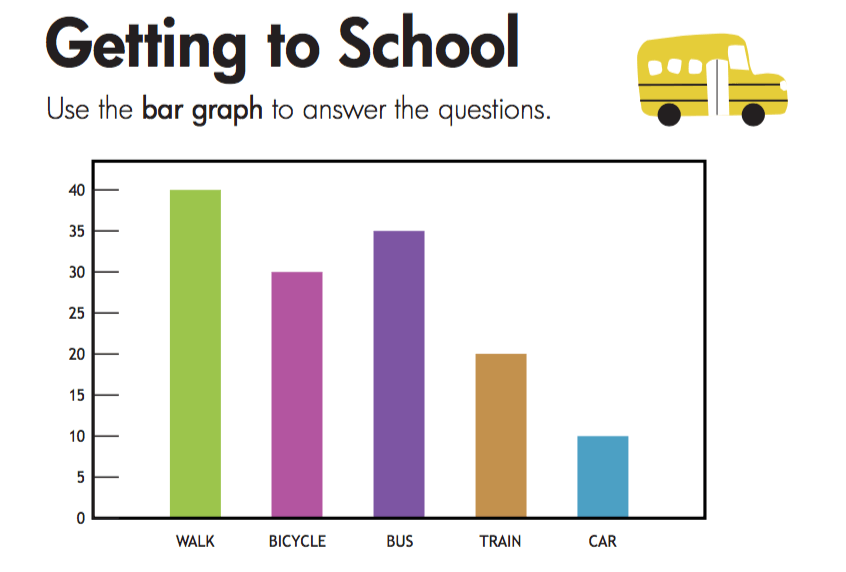
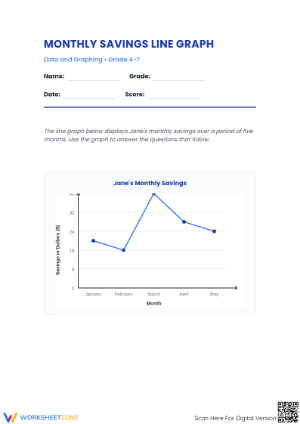
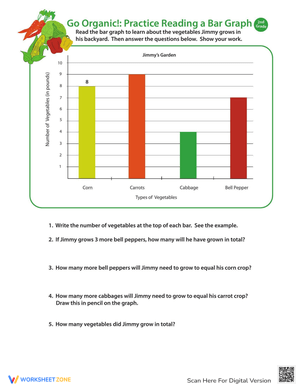
Scaled bar graphs and pictographs are covered with a clear emphasis on what changes at this grade level. In third grade, students work with scales of 1. Here, the intervals jump — increments of 2, 5, and 10 are common — and students use multiplication and division to determine actual values rather than reading them directly off the axis. Pictograph worksheets include data sets that require half-symbols, so students can't just count whole pictures and be done with it.
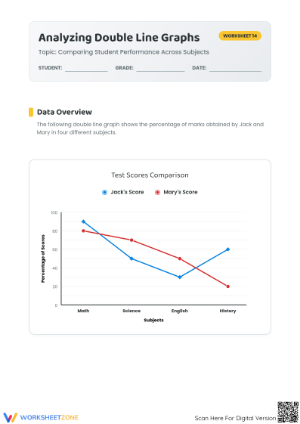
Interpretation questions throughout the set ask for range and mode, and several worksheets include two-step word problems that require pulling a value from the graph and then performing an operation with it. "How many more students chose soccer than basketball?" is a one-step question. "What is the total number of students who chose either soccer or swimming?" requires reading two bars and adding — that's the kind of thinking the set builds toward.
Mistakes Students Make That Are Worth Catching Early
The most predictable error on line plots is misplacement of the X mark. Students who understand fractions conceptually will still place the mark between tick marks rather than directly above the fractional value. They know where 5 and 3/4 sits on a mental number line, but translating that into a precise mark on the printed scale is a visual-spatial task that takes deliberate practice. Watch for students who cluster their marks slightly off-center — it usually isn't a fraction misconception, it's a precision issue that clears up with a few guided examples using a physical ruler alongside the worksheet.
On scaled bar graphs, a durable error pattern is reading the printed label on the y-axis rather than reasoning from the scale. A student who sees a bar reaching the line labeled "20" on a scale of 5 will write "20" without pausing. The answer happens to be correct, but the reasoning is broken — and it fails as soon as the bar stops between two labeled intervals. These worksheets surface that error because many of the interpretation questions require reading values between gridlines, not just at labeled marks.
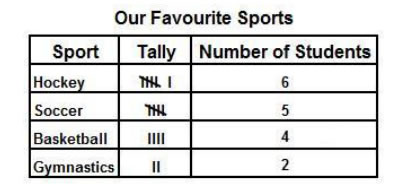
Pictograph half-symbols trip up a specific group of students: confident counters. They tally full symbols accurately but undercount or overcount when a half-symbol appears, especially when the key reads "each symbol = 4 students." Half of four is not automatic for a student who has been working with whole-number pictographs since second grade, and it's worth a direct class conversation before students work through those particular worksheets independently.
Fitting These Worksheets Into Your Math Block
The line-plot worksheets pair naturally with a brief hands-on data collection activity before the worksheet goes out. Have students measure classroom pencils to the nearest eighth of an inch, then bring that data to the page. The fractional plotting becomes concrete rather than abstract, and students take the interpretation questions more seriously because the numbers are their own. This setup takes roughly fifteen minutes total and makes the worksheet genuinely purposeful rather than rote.
Scaled graph worksheets work well as independent practice immediately after a direct instruction lesson on scale selection. After you model choosing a scale by looking at the data range, students work through a worksheet that provides the data table but requires them to select the scale before they begin drawing. Set a five-minute checkpoint: any student who hasn't settled on a scale by then gets a quick individual prompt rather than sitting stuck through the rest of the period.
Graphing data worksheets for 4th grade also fit cleanly as exit tasks at the close of a data lesson. A single line-plot interpretation question takes four to five minutes and tells you clearly which students can read a fractional scale and which are still estimating. That information shapes your next day's grouping without requiring a formal assessment.
Standard Alignment
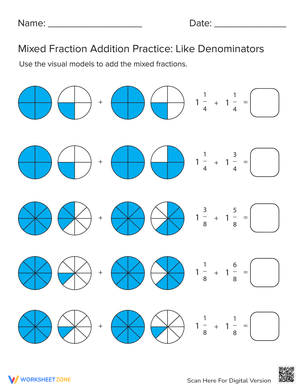
The primary standard addressed is CCSS.MATH.CONTENT.4.MD.B.4, which requires students to make a line plot to display a data set of measurements in fractions of a unit (halves, fourths, eighths) and to solve addition and subtraction problems using data shown in that plot. This standard sits in the Measurement and Data domain and connects directly to the fraction work in 4.NF — particularly adding fractions with like denominators. Teachers who sequence data work alongside fraction instruction find the two strands reinforce each other. A student who has just added 3/8 and 5/8 is far more prepared to total the X marks at the 3/8 and 5/8 positions on a line plot.
Scaled graph work extends CCSS.MATH.CONTENT.3.MD.B.3 from the prior year. By fourth grade, students are expected to work fluently with multi-unit scales and to generate multi-step questions from graph data. These worksheets give that extension practice without requiring teachers to design it from scratch.
Adjusting the Worksheets for a Range of Learners
For students still shaky on fraction concepts, begin with line-plot worksheets that use halves only. Once they can locate and plot halves consistently, move to fourths, then eighths. The cognitive load of reading a fractional scale is real, and rushing past halves because the standard lists all three fractions is a planning mistake that shows up in students' work as persistent X-mark errors. Let accuracy with halves tell you when to move forward.
For students who are ready for more, the multi-step interpretation questions are the right pressure point. Ask them to write their own data questions to accompany a completed graph — not just answer the printed ones. Generating a question that requires two operations to answer demands a deeper understanding of what the graph actually contains. Some fourth graders find this harder than constructing the graph itself, and it's a useful challenge that doesn't require any additional materials.
Students who struggle with fine motor precision on line plots benefit from worksheets with larger tick marks and a wider x-axis. The frustration of misplacing marks often leads to avoidance rather than a math misconception — a slightly more generous layout keeps those students focused on the data rather than the mechanics of placing a mark.
Frequently Asked Questions
Do students need to know how to draw their own axes before using these worksheets?
No. Each worksheet provides pre-drawn axes with labeled scales. Students focus on reading and plotting data rather than constructing a grid from scratch. Once students are confident interpreting graphs, you can shift them toward designing their own — but the resources in this set are built for the plotting and interpretation stage.
How should I introduce the idea of choosing a scale for a bar graph?
Start with the range of the data set. If the largest value is 45, a scale of 1 is too fine and a scale of 20 leaves the graph nearly empty. Walk students through comparing the data range to candidate increments — by 2s, by 5s, by 10s — before settling on one. Several worksheets provide the data table but leave the scale selection to the student, which makes this a genuine decision rather than a fill-in task. Students who get this wrong will immediately see that their bars run off the page or cluster invisibly near the x-axis — and that concrete consequence is often the best corrective.
Are these worksheets appropriate for third-grade preview or fifth-grade remediation?
These graphing data worksheets for 4th grade are built around fourth-grade content and vocabulary, so they fit best as on-level practice. For third-grade teachers previewing scaled graphs, the bar-graph worksheets transfer reasonably well, but the fractional line-plot worksheets assume fraction knowledge most third graders haven't developed yet. For fifth graders who need to shore up foundational data skills, the full set works — the content and task types are serious enough that older students don't find it condescending.
Can I connect these worksheets to a science unit?
Yes, and the pairing is a strong one. The line-plot format suits recording measurement data directly — plant growth to the nearest quarter inch over several weeks, or daily temperature readings rounded to the nearest half degree both work well. Students who collect real data and then plot it on graphing data worksheets for 4th grade tend to engage more carefully with the interpretation questions because the numbers carry meaning. The worksheets provide the structure; the science unit provides the context.













 Interactive Worksheet Maker
 Quiz Maker
 Word Search Maker
 Crossword Puzzle Maker
 Word Scramble Generator
 Sentence Scramble Generator
 Handwriting Worksheet Generator
 Name Tracing Generator
 Fill In The Blank Generator