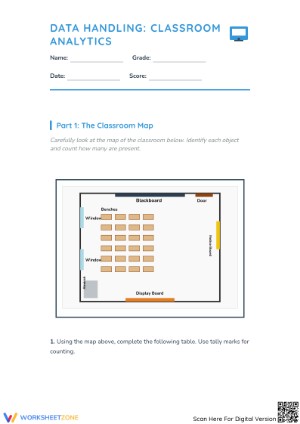
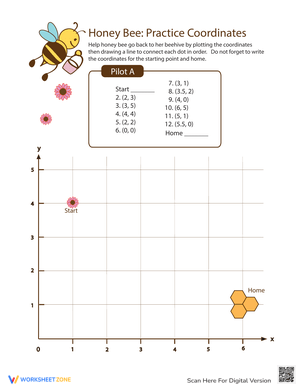
These 4th grade data worksheets resources give teachers a ready set of line plot, frequency table, and data interpretation practice — the cluster of skills where Grade 4 data work actually concentrates. Students move from partitioning fractional number lines from scratch to solving addition and subtraction problems drawn directly from plotted data, which means fraction fluency and data reading get practiced together rather than in separate units.
Concepts Covered Across the Set
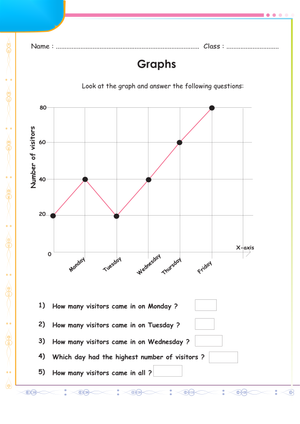
The central skill is the fractional line plot, and these worksheets build it from two directions: construction and interpretation. On the construction side, students receive a data set — typically a list of measurements recorded to the nearest 1/2, 1/4, or 1/8 inch — and must set up a number line with correctly spaced fractional intervals, then place each data point. On the interpretation side, a completed line plot is already drawn and students answer questions about the spread, the most common measurement, and the difference between the highest and lowest values.
Each worksheet also includes fraction computation problems rooted in the data itself. Rather than asking students to compute fractions in the abstract, the questions are structured like this: "The four objects that measure 2 3/4 inches — what is their combined length?" That setup forces students to decide which operation to use before they calculate, which is harder than isolated fraction drills and more representative of what real data use actually requires.
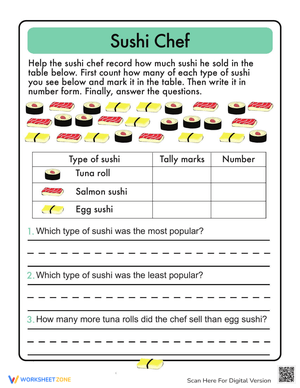
Bar graphs and pictographs appear as well, mostly as a review bridge. Students who struggled with those representations in Grade 3 benefit from encountering them again alongside the new line plot content, and the worksheets include a small number of each to reinforce rather than reteach.
Errors That Surface Once Fractions Enter the Picture
The most persistent error on fractional line plots is uneven interval spacing. A student who can correctly label 1/4, 1/2, and 3/4 on a fraction number line will still draw those marks unevenly when setting up a line plot from scratch — often crowding the fractions near the left whole number and leaving a gap before the next. The plot looks labeled to the student but makes the visual distribution meaningless. Having a pre-drawn number line on select worksheets addresses this without eliminating the construction practice entirely.
The second error is more diagnostic: when a data set contains multiple identical measurements, students frequently plot a single mark instead of stacking the correct number. A list with five objects measuring 3 1/2 inches gets one X above 3 1/2. This isn't a fraction error — it's a misreading of what a line plot actually represents, and it often goes undetected until students get a wrong answer on a "how many total" question.
On the computation side, students mix up what they're being asked to find. Asked for the total length of all objects measuring 5 1/4 inches, many students count the data points instead — four of them, say — and write "4" as their answer. They've found the frequency rather than the total. This confusion between frequency and magnitude is worth naming explicitly before independent work begins, because students repeat the error confidently if they don't know to look for it.
Where These Worksheets Fit in Your Instructional Sequence
The most effective placement is directly after a hands-on measurement activity, while students still have physical context for the numbers. One approach that works consistently: have the class measure each student's index finger from knuckle to fingertip to the nearest 1/8 inch, record the measurements on the board, and then use a 4th grade data worksheets as the whole-class activity to organize and plot that data. Students who helped generate the numbers are more invested in the analysis, and errors in measurement technique become visible before they transfer to the worksheet.
For independent practice, these worksheets work well in a three-station rotation. One group constructs line plots from a new data set, another group answers interpretation questions from a completed graph, and a third group works on the fraction computation problems embedded in the data context. That setup lets you pull students who are struggling with interval spacing for a short focused reteach while the other groups work without you.
As a warm-up, a single interpretation worksheet fits inside the 8 to 10 minutes after morning meeting — enough time to examine a pre-drawn line plot, answer two or three questions, and talk through the answers before the day's main lesson begins.
Standard Alignment
4.MD.B.4 — "Make a line plot to display a data set of measurements in fractions of a unit (1/2, 1/4, 1/8). Solve problems involving addition and subtraction of fractions by using information presented in line plots." This is the organizing standard for the set. In classroom terms, it sits at the intersection of two units: measurement and fractions. Most Grade 4 programs introduce it after students have worked with equivalent fractions and fraction comparison, because students need to order fractional values accurately before they can position them correctly on a number line. Teachers who place these worksheets after the fraction equivalence unit and before end-of-year measurement review tend to see the strongest results.
Calibrating the Work for Mixed-Ability Classrooms
Students who are still shaky on equivalent fractions need additional support before working with eighths on a line plot. For those students, start with worksheets that use only halves and fourths, and give them a fraction strip or number line reference card to hold next to their work. This provides a visual reference without removing the cognitive work of deciding where each data point belongs.
On the other end of the range, students who move through construction quickly benefit from data sets that require them to recognize equivalent placements — for instance, understanding that 4/8 and 1/2 belong at the same point before plotting either value. A 4th grade data worksheets with multi-step word problems built into the interpretation section serves these students without requiring an entirely separate resource. Problems like "find the difference between the combined length of all objects measuring 1/4 inch and the combined length of all objects measuring 3/8 inch" demand careful reading and multiple operations, which is exactly where advanced fourth graders need to be pushed.
Frequently Asked Questions
How do these worksheets address 4.MD.B.4?
Each line plot worksheet directly targets the two requirements of 4.MD.B.4: students construct line plots using fractional measurements, and they solve fraction addition or subtraction problems drawn from the data they've plotted. The bar graph and pictograph materials support the broader Grade 4 measurement cluster but are not the primary alignment target for this standard.
What types of graphs are included?
Fractional line plots are the focus. The set also includes bar graphs and pictographs for review — these appear in a Grade 4 context with more demanding interpretation questions than students encountered in Grade 3, so the review serves a real instructional purpose rather than just repeating earlier work.
Can these be used for assessment?
A single interpretation worksheet works well as a lesson-exit formative check — five or six targeted problems reveal whether students can read a fractional line plot accurately and perform the associated fraction operations. For a unit assessment, a 4th grade data worksheets that combines both construction and multi-step computation problems gives a fuller picture of what students have retained across the data and measurement unit.
What do students find hardest about Grade 4 line plots?
Interval spacing and the stacking of repeated values are the two most common sticking points — both described in the error section above. Beyond those, the most consistent struggle is distinguishing between questions asking for a count of data points and questions asking for a total measurement, especially when fractions are involved. Repeated work across multiple worksheets builds the habit of reading the question carefully before reaching for a calculation.













 Interactive Worksheet Maker
 Quiz Maker
 Word Search Maker
 Crossword Puzzle Maker
 Word Scramble Generator
 Sentence Scramble Generator
 Handwriting Worksheet Generator
 Name Tracing Generator
 Fill In The Blank Generator