


Views
Downloads


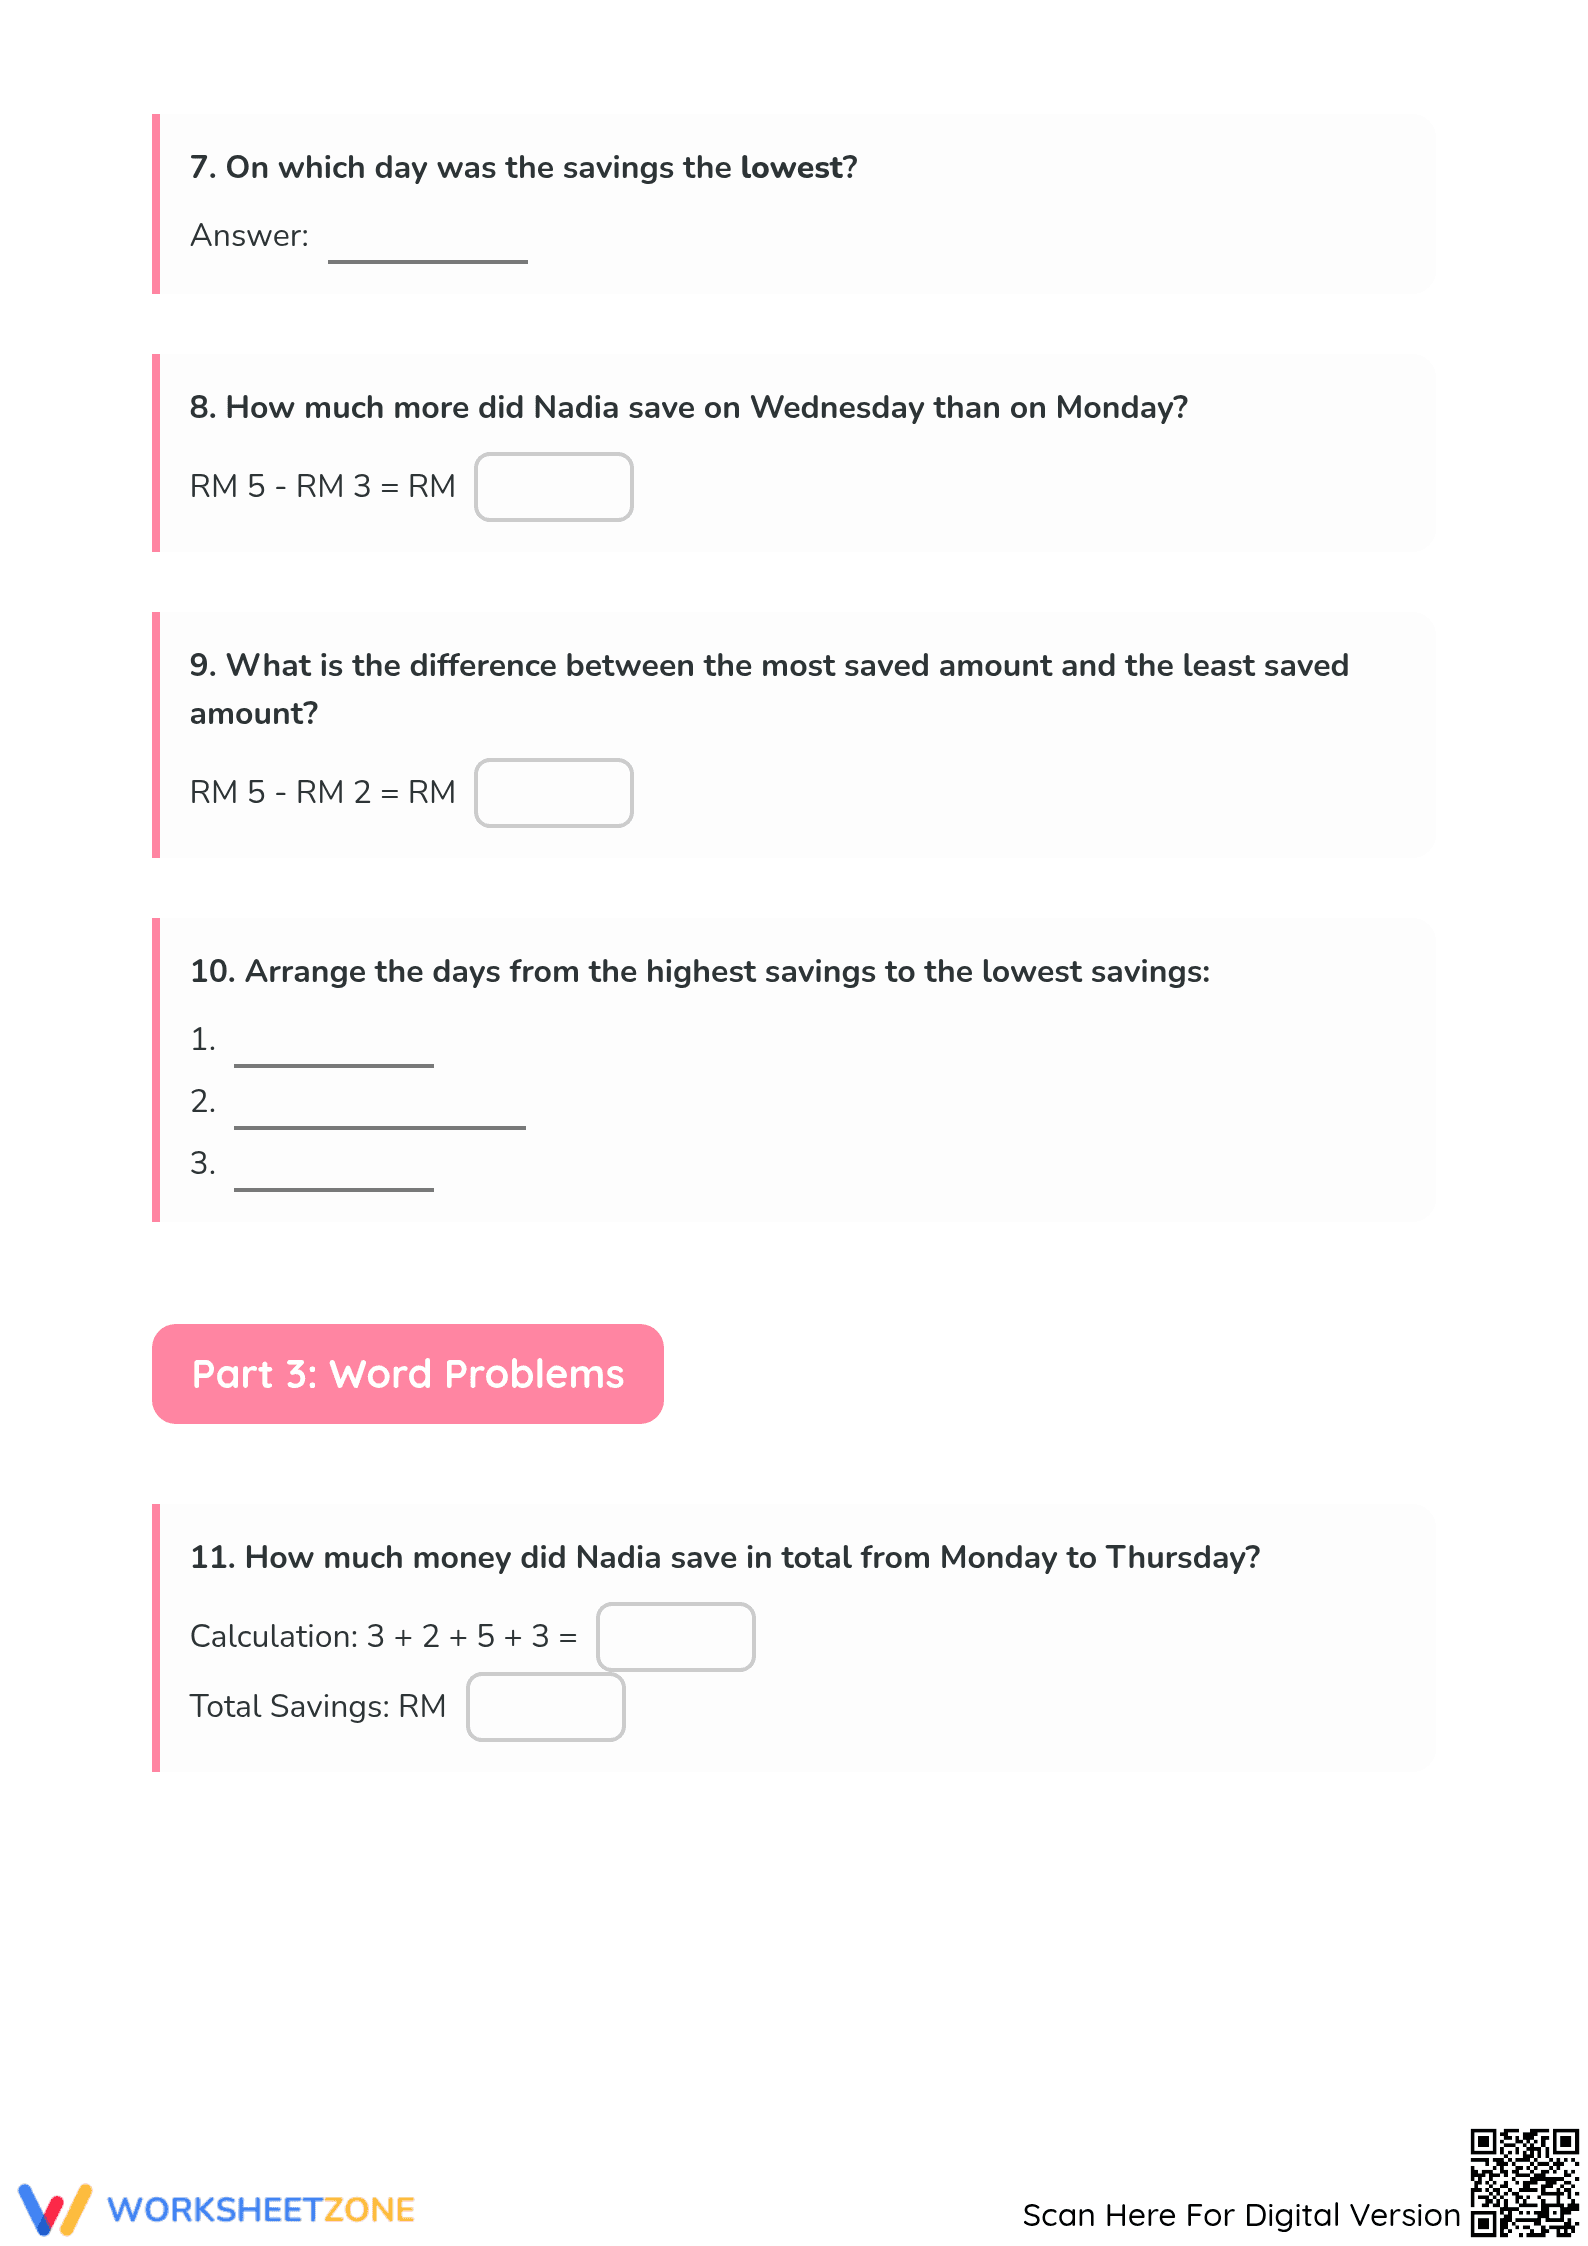


Grade 2 Data — Printable Pictograph Worksheet
Paste this activity's link or code into your existing LMS (Google Classroom, Canvas, Teams, Schoology, Moodle, etc.).
Students can open and work on the activity right away, with no student login required.
You'll still be able to track student progress and results from your teacher account.
Description
This worksheet provides focused practice for Grade 2 and 3 students on interpreting pictographs. Students will answer 12 targeted questions based on three different picture graphs, strengthening their ability to collect, read, and analyze simple data sets. This resource is designed to build foundational data literacy skills in a clear and engaging format.
At a Glance
- Grade: 2–3 · Subject: Math (Data)
- Standard:
CCSS.MATH.CONTENT.2.MD.D.10— Represent and interpret data using picture graphs.- Skill Focus: Interpreting Pictographs
- Format: 3 pages · 12 problems · Answer key included · PDF
- Best For: Independent practice or formative assessment
- Time: 15–25 minutes
What's Inside
This resource is a three-page worksheet with 12 questions. Each page features a unique pictograph and four questions requiring students to interpret the data. A full two-page answer key is included for quick grading or self-checking. The file is a print-ready PDF.
Zero-Prep Workflow
This worksheet is designed for classroom efficiency. 1. Print the pages from the PDF (under 1 minute). 2. Distribute for independent work; the instructions are self-explanatory (under 1 minute). 3. Review using the answer key. Total teacher prep is under 2 minutes, making it perfect for sub plans, math centers, or homework.
Standards Alignment
This worksheet aligns with CCSS.MATH.CONTENT.2.MD.D.10, where students learn to represent and interpret data. It specifically targets the interpretation component, building the skills needed to solve problems using pictographs. The standard code can be copied directly into lesson plans or curriculum maps.
How to Use It
Use this worksheet for independent practice after a lesson on pictographs. It’s an effective formative assessment; observe if students can accurately use the key to find totals. It also works well as a focused homework task. Most students will complete it in 15-25 minutes.
Who It's For
This resource is for second graders learning data representation or third graders needing review. The clear layout is accessible for most students. It pairs well with a hands-on activity where students build their own pictograph using manipulatives after completing the worksheet.
This pictograph worksheet provides targeted practice aligned with CCSS.MATH.CONTENT.2.MD.D.10, a critical early data literacy standard. By engaging with these materials, students develop the foundational skill of interpreting data from picture graphs, which involves using a key to understand one-to-one correspondence and answering comparison and total-value questions. Research from RAND AIRS 2024 highlights the importance of early, repeated exposure to data representations for building quantitative reasoning skills that are predictive of later math achievement. This type of focused, non-digital practice has been shown to be effective for skill consolidation. Providing students with structured problems like these builds their confidence and competence in handling data, a skill essential for navigating an information-rich world and for future success in statistics and science coursework.