


0
Views
0
Downloads
0.0
0
Save
0 Likes
Election Graph Worksheet
0 Views
0 Downloads
Paste this activity's link or code into your existing LMS (Google Classroom, Canvas, Teams, Schoology, Moodle, etc.).
Students can open and work on the activity right away, with no student login required.
You'll still be able to track student progress and results from your teacher account.
Information
Description
What It Is:
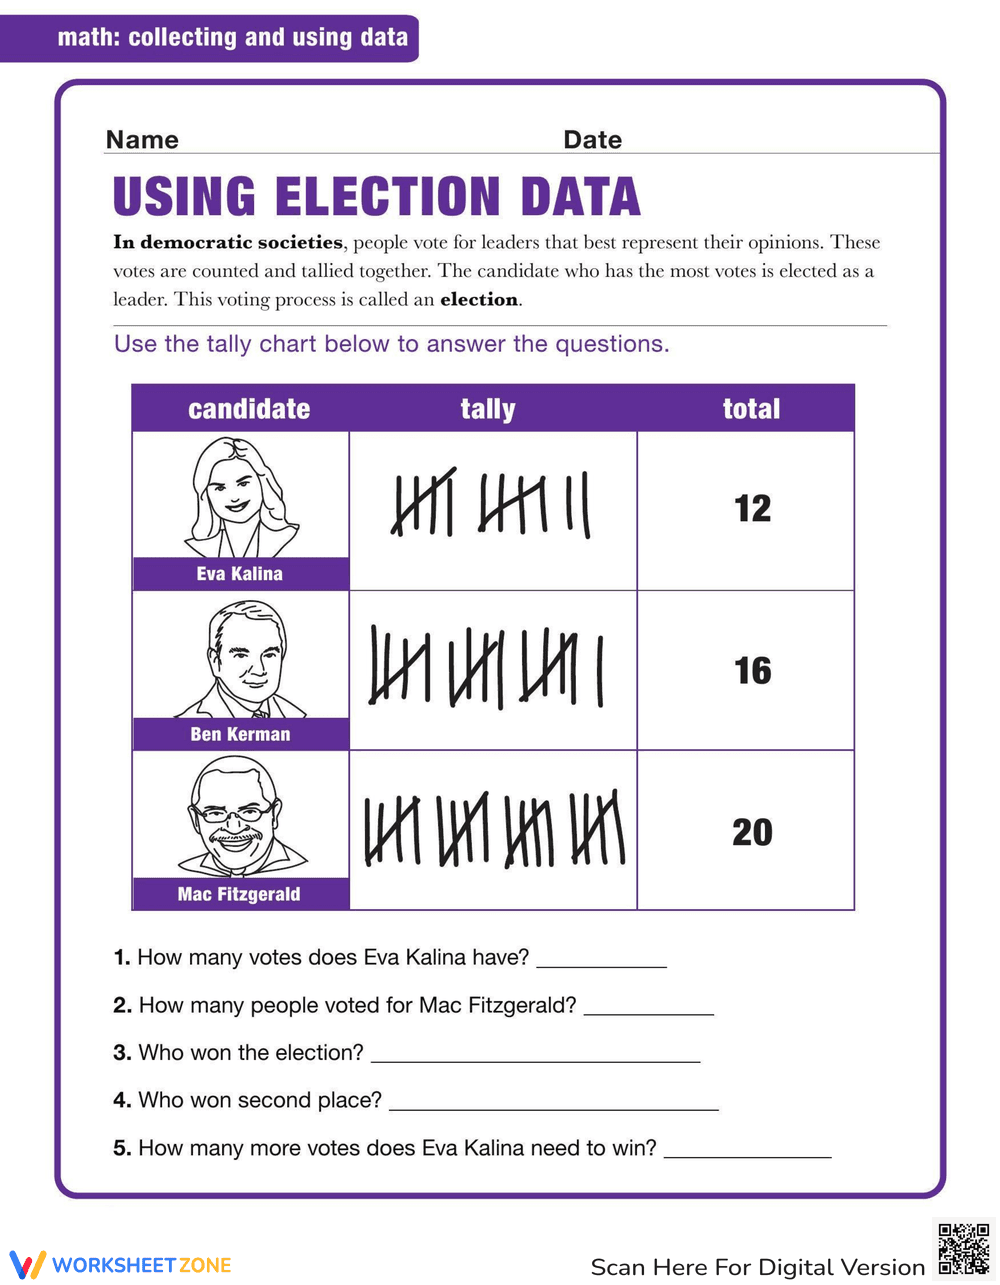
This is a math worksheet titled 'Using Election Data' focused on collecting and using data. It presents a tally chart showing the votes for three candidates: Eva Kalina, Ben Kerman, and Mac Fitzgerald. The tally chart shows the tally marks for each candidate and the total number of votes they received. The worksheet includes five questions based on the data in the tally chart, such as 'How many votes does Eva Kalina have?' and 'Who won the election?'.
Grade Level Suitability:
This worksheet is suitable for grades 2-4. The concepts of tallying, reading data from a chart, and basic subtraction are typically taught in these grades. The context of an election provides a real-world application of these math skills.
Why Use It:
This worksheet helps students practice data collection and interpretation skills. It reinforces the concept of tallying and provides practice in reading and interpreting data presented in a chart. It also introduces the concept of elections and how data is used to determine the winner.
How to Use It:
Students should first read the introductory paragraph about elections. Then, they should carefully examine the tally chart and identify the number of votes each candidate received. Finally, they should use the information from the chart to answer the five questions, writing their answers in the provided spaces.
Target Users:
This worksheet is ideal for elementary school students in grades 2-4 who are learning about data collection, tallying, and interpreting data from charts. It can also be used to introduce the concept of elections and voting.