


Views
Downloads


Printable Data and Graphing Adventure | Grade 1-2 Math
Paste this activity's link or code into your existing LMS (Google Classroom, Canvas, Teams, Schoology, Moodle, etc.).
Students can open and work on the activity right away, with no student login required.
You'll still be able to track student progress and results from your teacher account.
This comprehensive math resource provides structured practice for students learning to interpret and create visual data representations. By working through various scenarios involving favorite drinks, colors, and insects, learners develop the essential ability to extract meaning from tally charts and picture graphs. The activities emphasize comparing categories and calculating totals, ensuring a solid foundation in elementary statistics.
At a Glance
- Grade: 1–2 · Subject: Math
- Standard:
CCSS.MATH.CONTENT.1.MD.C.4— Organize, represent, and interpret data with up to three categories efficiently- Skill Focus: Graphing and Data Analysis
- Format: 4 pages · 17 problems · Answer key included · PDF
- Best For: Independent practice or substitute teacher plans
- Time: 30–45 minutes
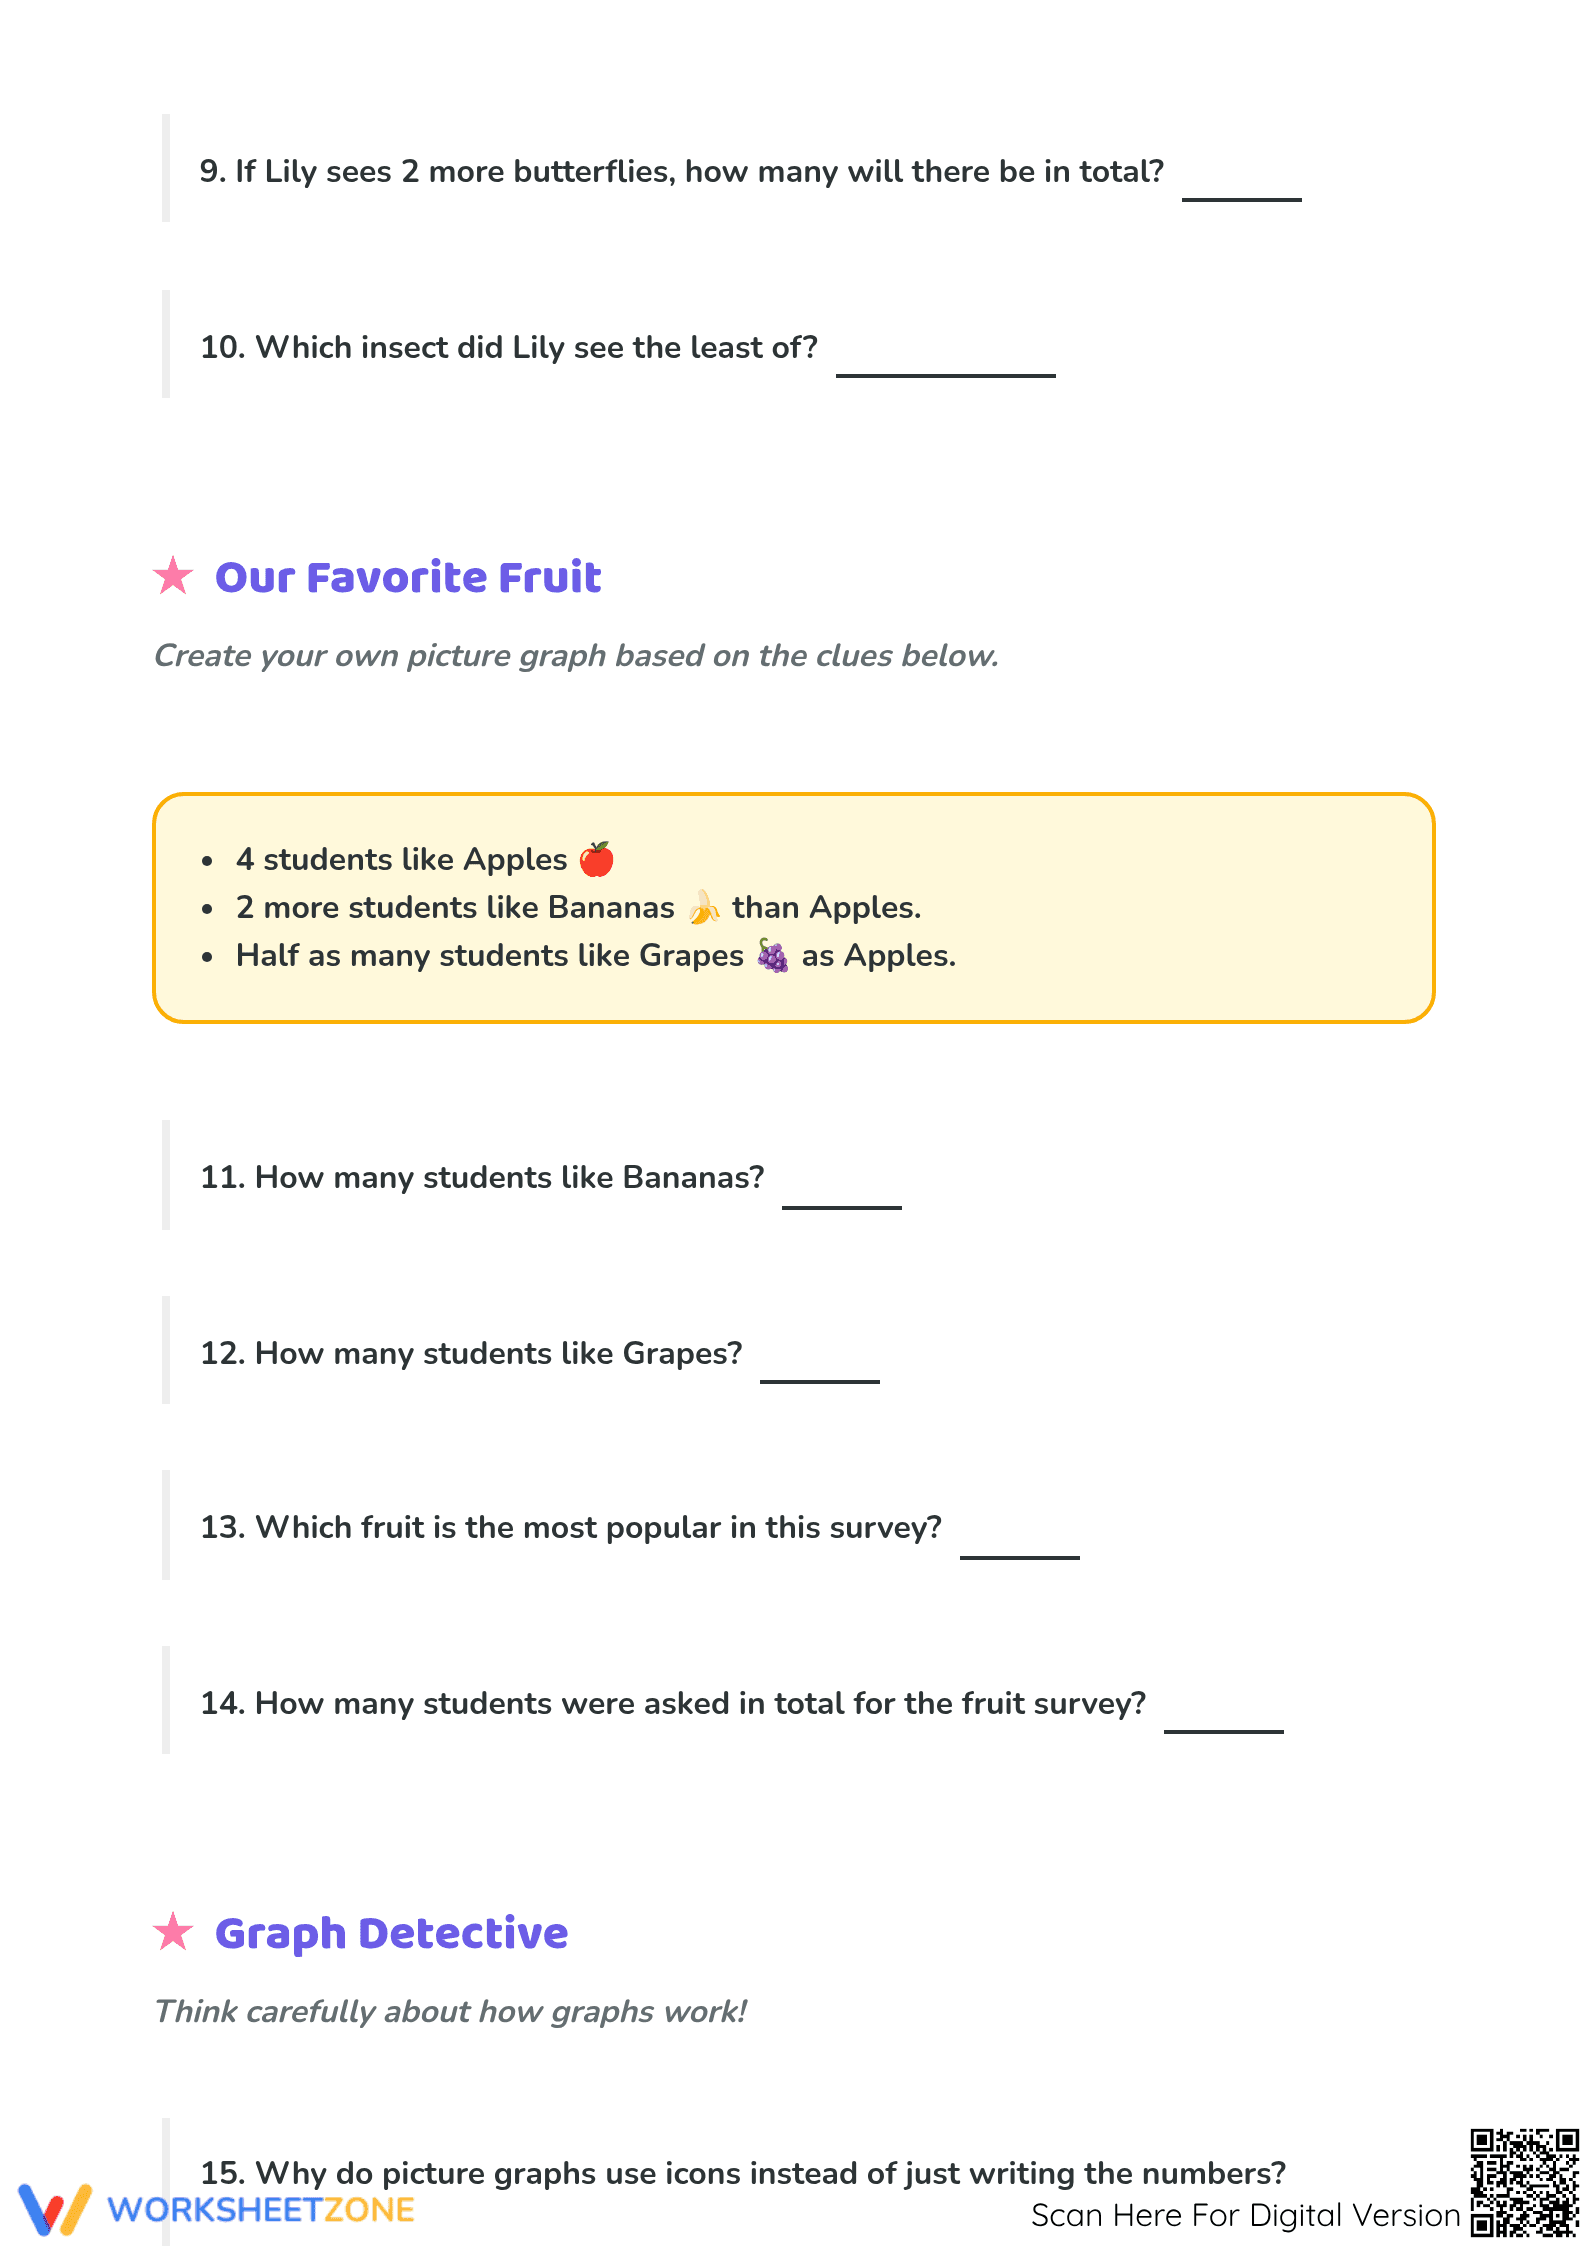
Inside this packet, teachers will find four distinct sections that progress in complexity. The first page uses a picture graph of lunch drinks to teach comparative language like "more than" and "fewer than." Subsequent pages introduce tally marks, requiring students to translate strokes into data points. A unique section provides written clues about fruit preferences, challenging students to construct their own graph from scratch before answering analytical questions.
This resource is designed for a zero-prep workflow to save valuable instructional time. Teachers can print the four-page set in less than 1 minute, distribute it to the class in under 2 minutes, and review the results using the provided answer key during the final 5 minutes of the period. Because the instructions are self-explanatory and the layout is intuitive, this worksheet is an ideal choice for emergency substitute folders or quiet independent work blocks.
The content is strictly aligned to CCSS.MATH.CONTENT.1.MD.C.4, which requires students to organize and represent data with up to three categories. Students must ask and answer questions about the total number of data points and determine how many more or less are in one category than in another. This standard code can be copied directly into lesson plans, IEP goals, or district curriculum mapping tools to ensure compliance with state and national requirements.
To maximize effectiveness, use this worksheet as a formative assessment after a direct instruction lesson on tallying. One helpful observation tip is to watch if students physically mark off items as they count them in the "Garden Insect Count" section, which indicates strong organizational habits. The expected completion time for most second graders is 35 minutes, while first graders may benefit from completing the first two pages during one session and the final two later.
This activity is built for first and second-grade students who are ready for independent data work. It provides enough visual support for English Language Learners through the use of icons while still demanding higher-order thinking in the "Graph Detective" section. For best results, pair this worksheet with a short reading passage about surveys or a classroom anchor chart that defines the key parts of a graph, such as the title and key.
Early exposure to structured data interpretation is a critical predictor of later success in algebraic thinking and complex problem-solving, as highlighted by the RAND AIRS 2024 analysis. This worksheet develops "comparative data literacy" through multi-step operations like adding totals and subtracting to find category differences. Engaging with 17 distinct tasks builds stamina for standardized assessments and masters the CCSS.MATH.CONTENT.1.MD.C.4 standard. The "Graph Detective" section promotes metacognition, encouraging students to explain visual aids' purpose, fostering a deeper understanding beyond rote calculation and recognizing graphs' functional role in clear communication across disciplines.