


























Views
Downloads

Printable Data Handling Worksheet | Grade 4 Charts & Graphs
Paste this activity's link or code into your existing LMS (Google Classroom, Canvas, Teams, Schoology, Moodle, etc.).
Students can open and work on the activity right away, with no student login required.
You'll still be able to track student progress and results from your teacher account.
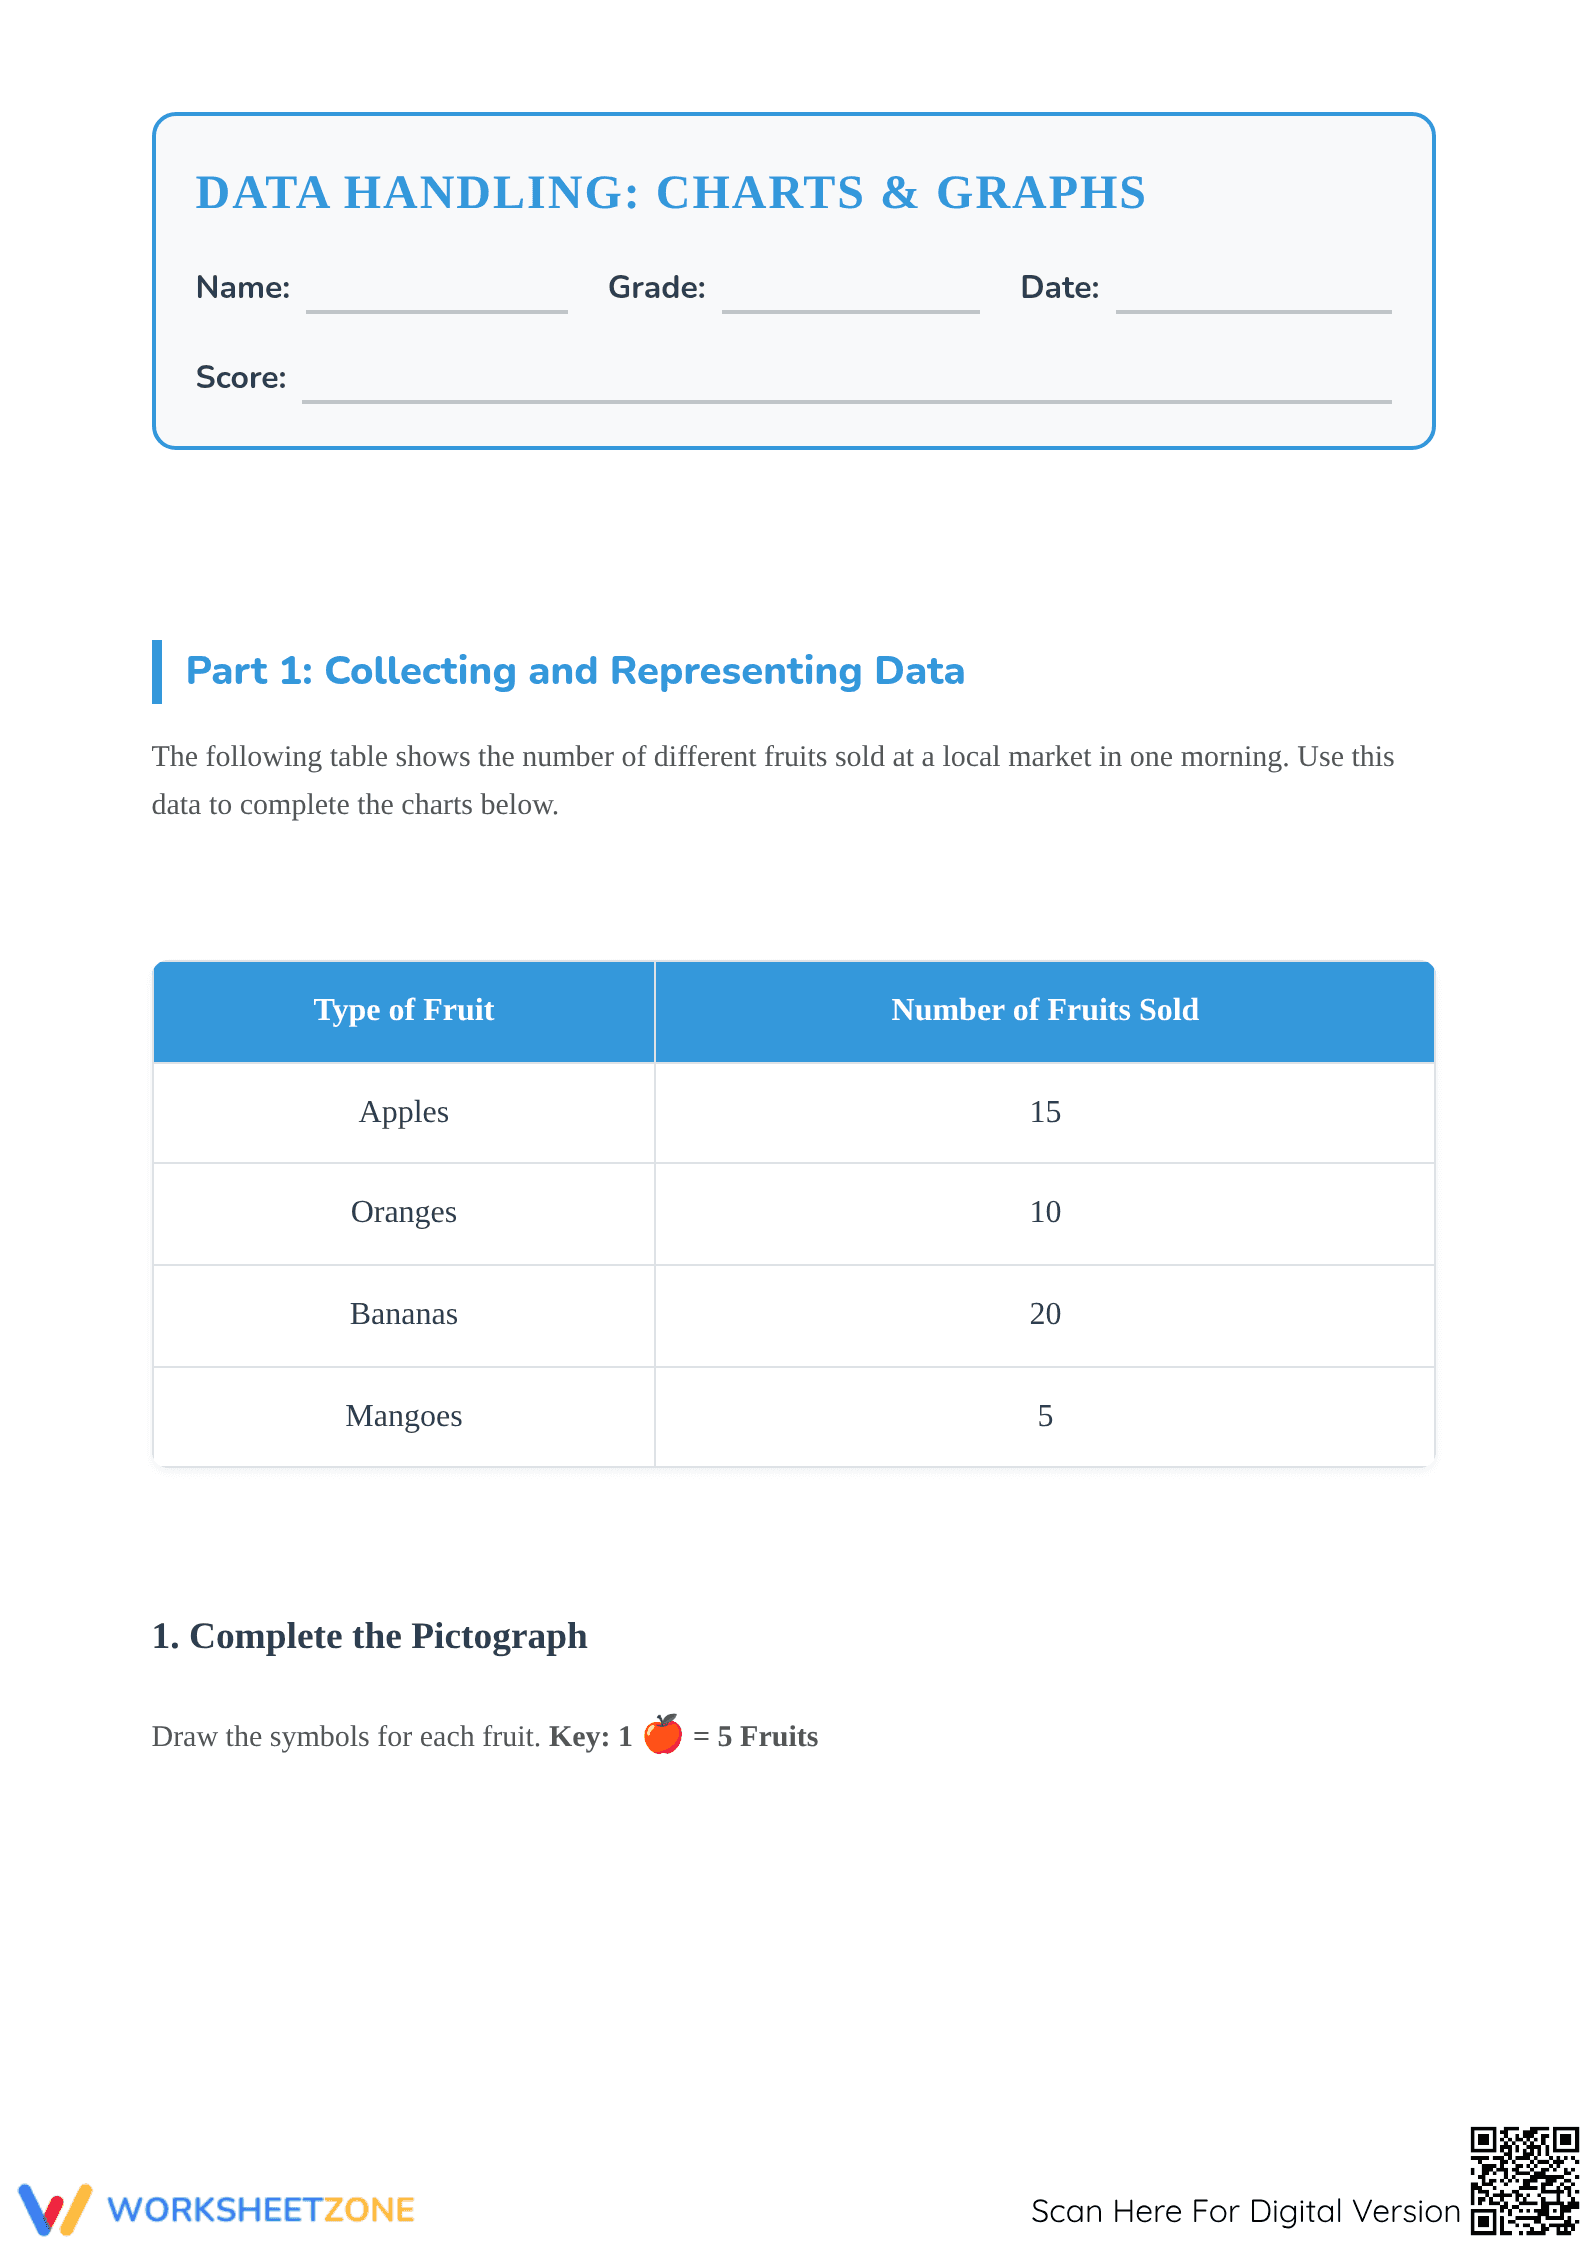
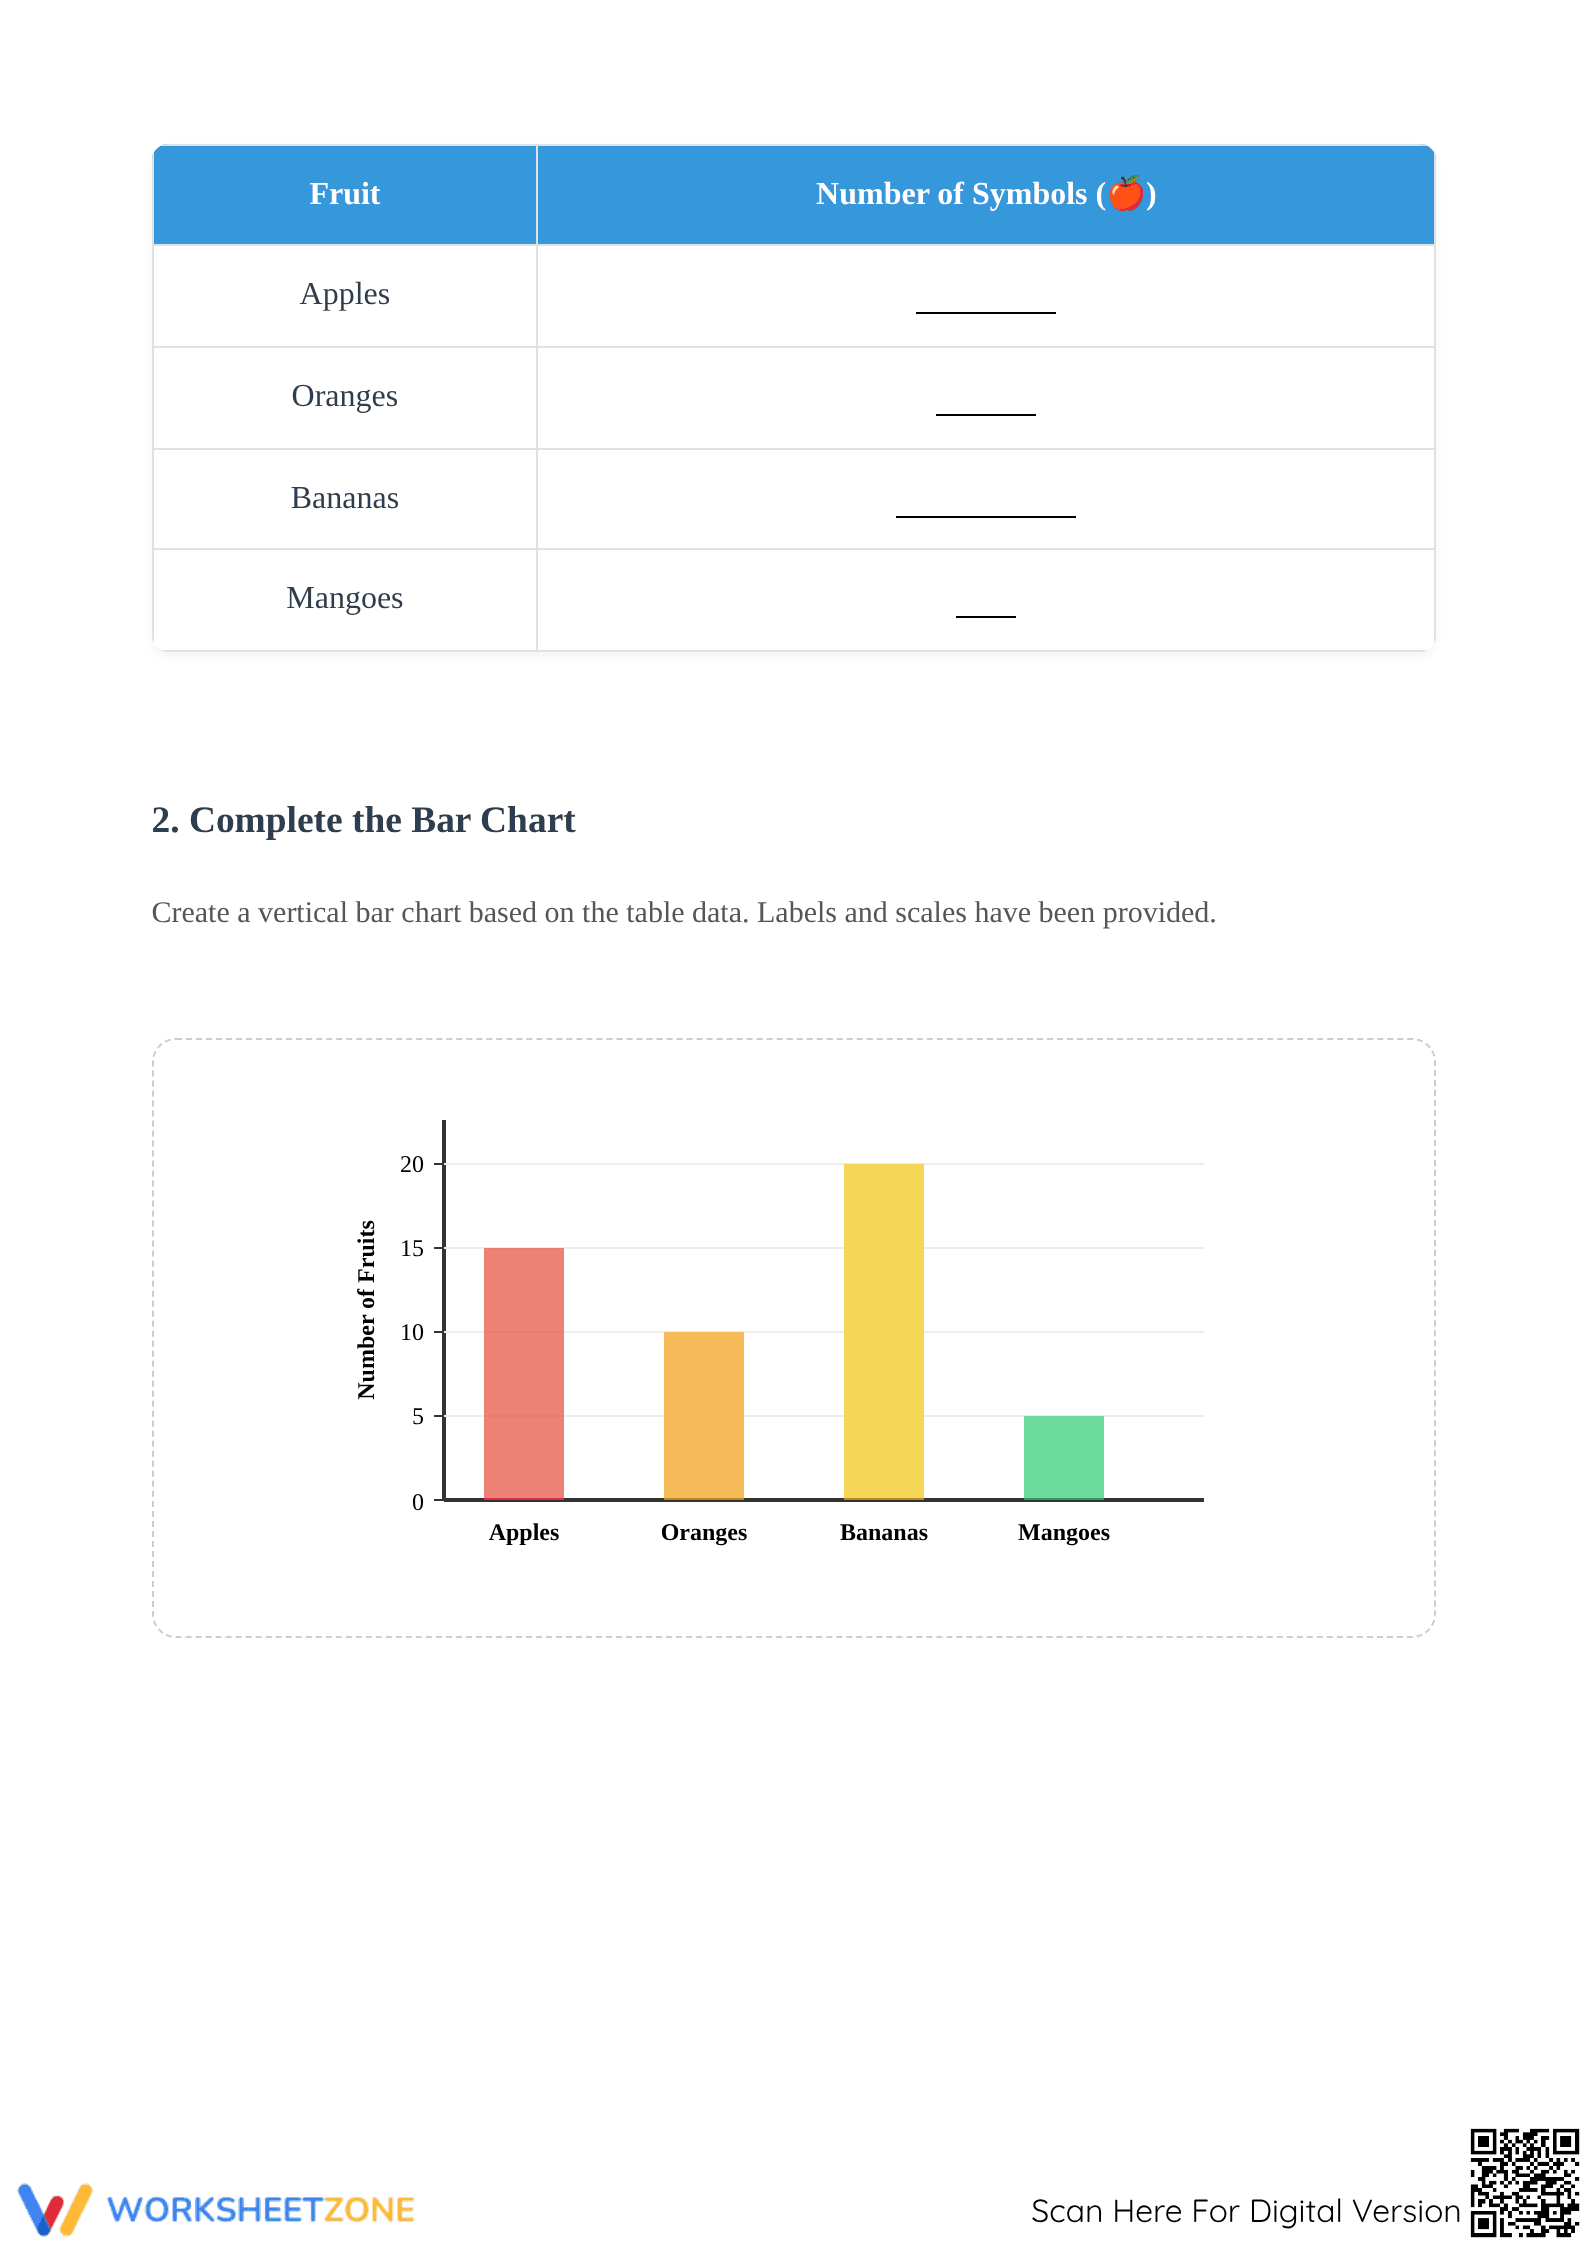
This Grade 4 data handling worksheet empowers students to master the relationship between different data representations by completing and analyzing pictographs, bar charts, and pie charts. Students transition from raw data tables to visual models, ensuring they can translate information accurately across multiple formats. This comprehensive 4-page resource includes 13 structured problems and a full answer key. Ideal for independent practice or formative data assessment, students can typically complete this in 25–35 minutes.
At a Glance
- Grade: 4 · Subject: Math
- Standard:
CCSS.MATH.CONTENT.4.MD.B.4— Make a line plot or chart to display a data set of measurements - Skill Focus: Multi-modal data representation and analysis
- Format: 4 pages · 13 problems · Answer key included · PDF
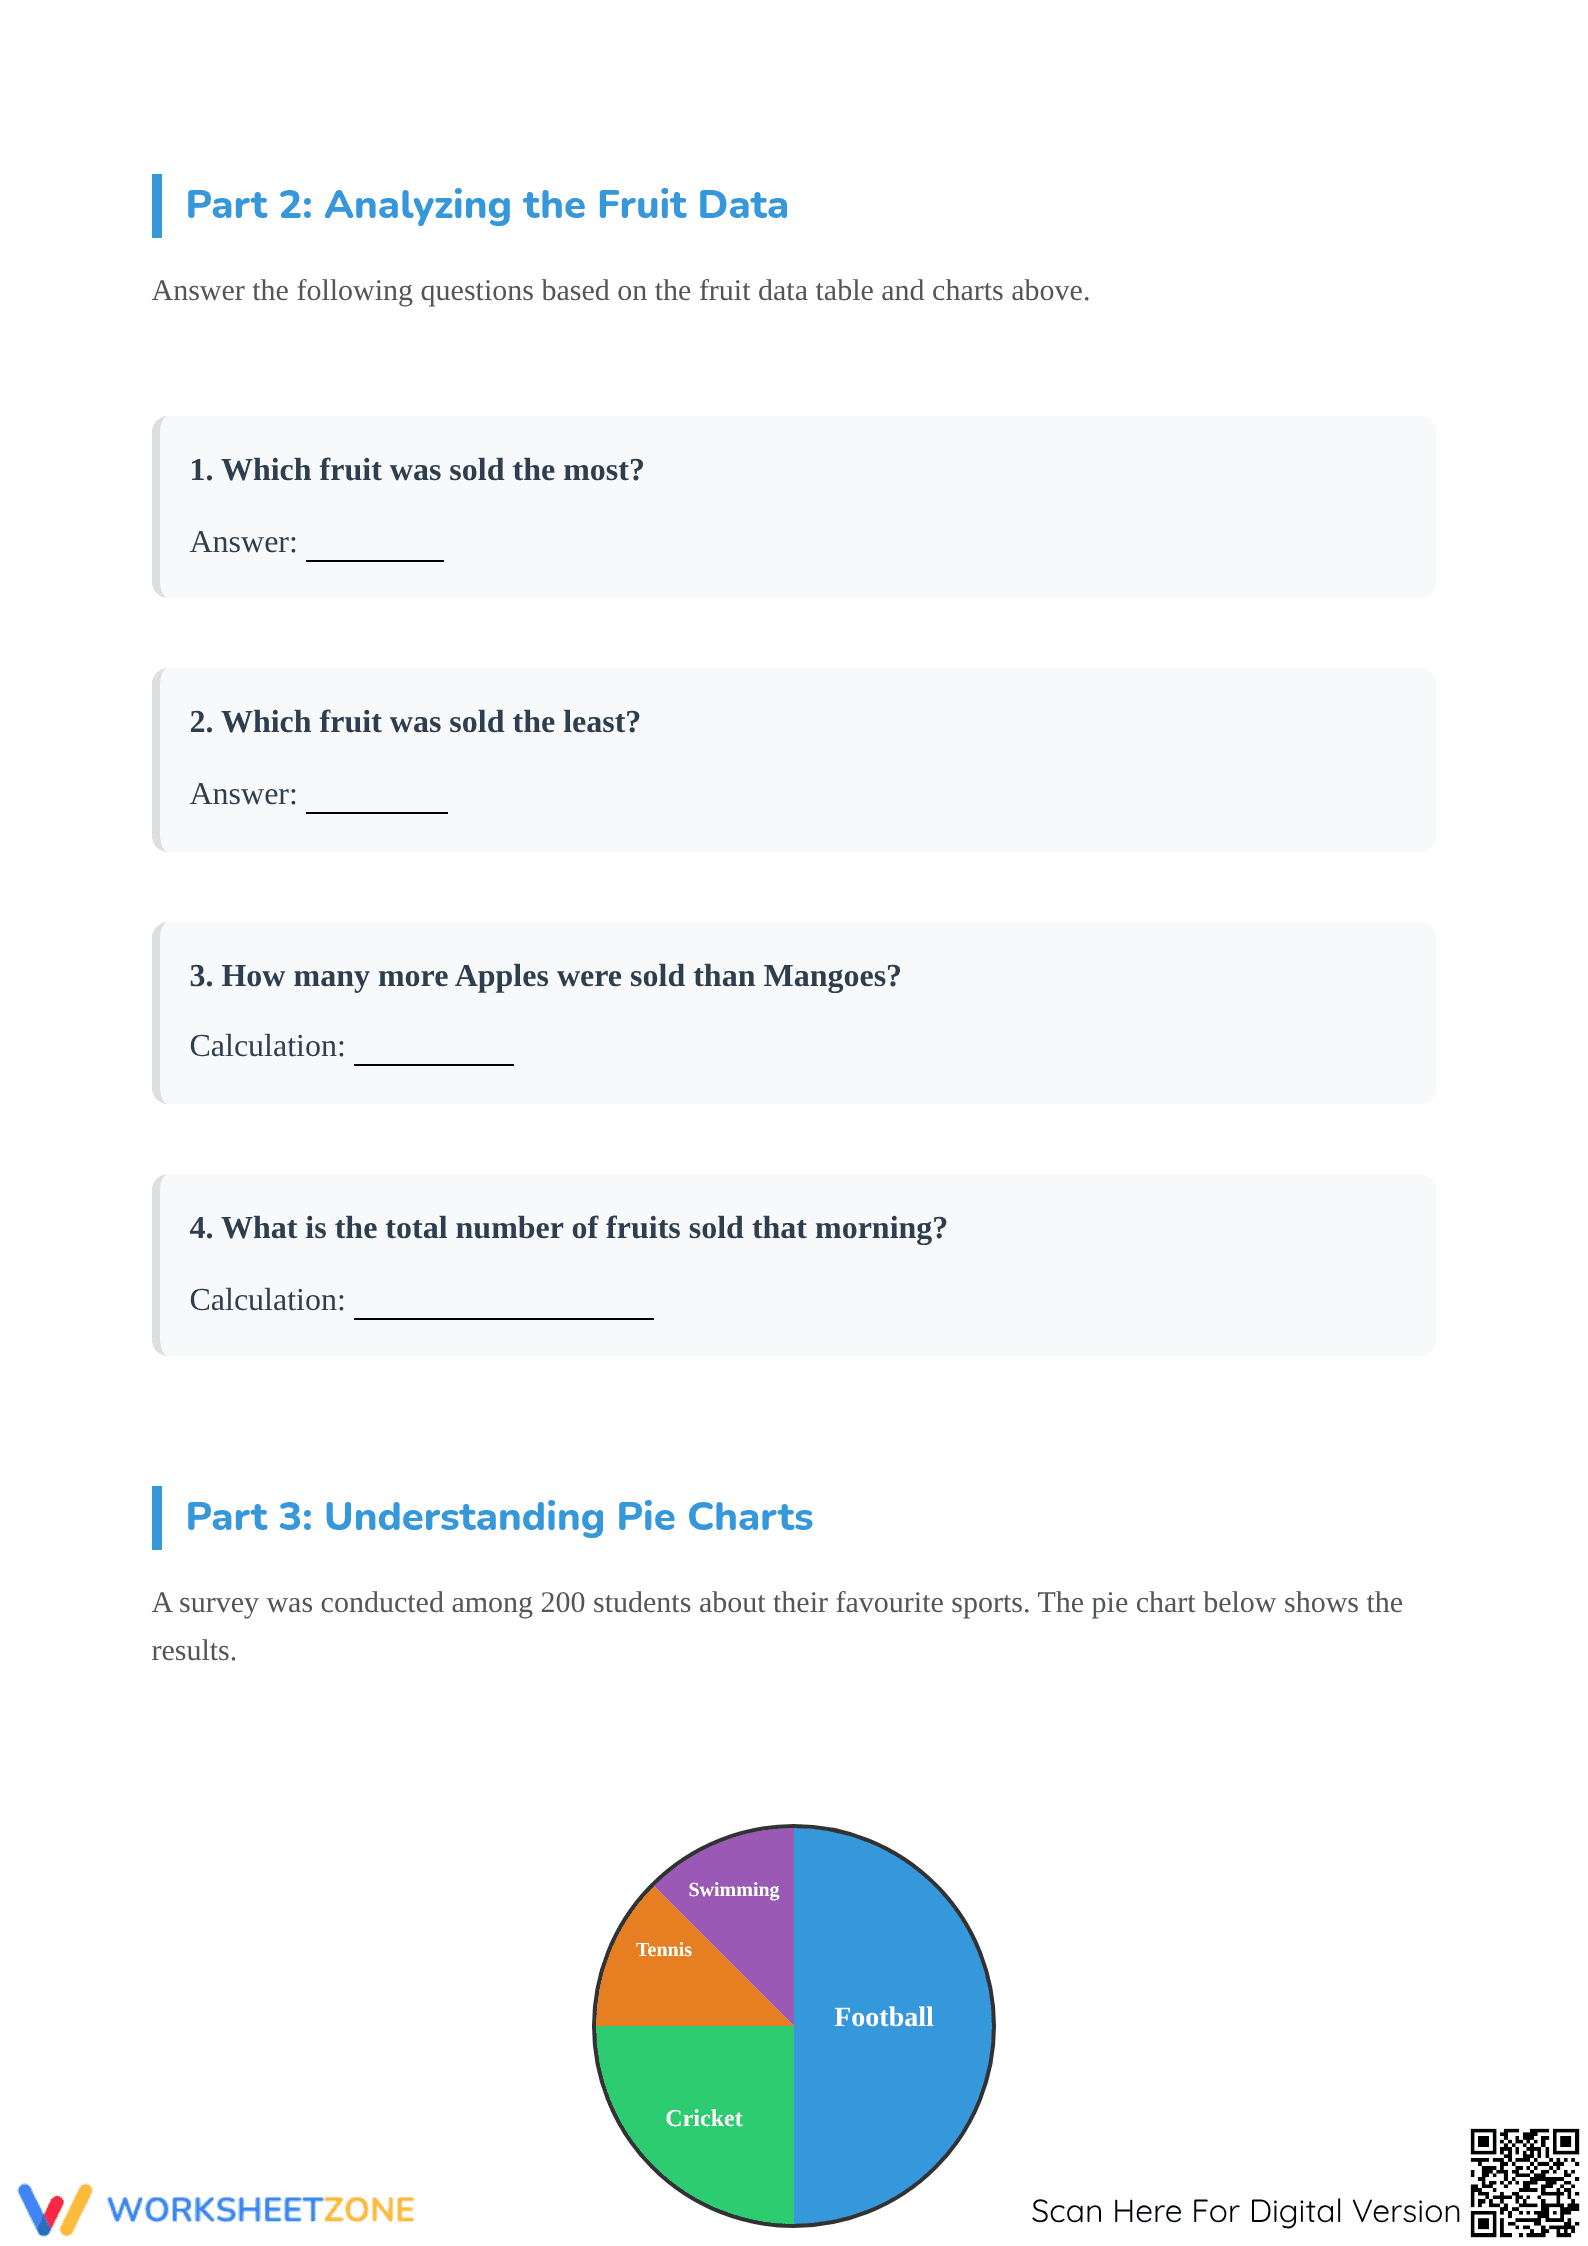
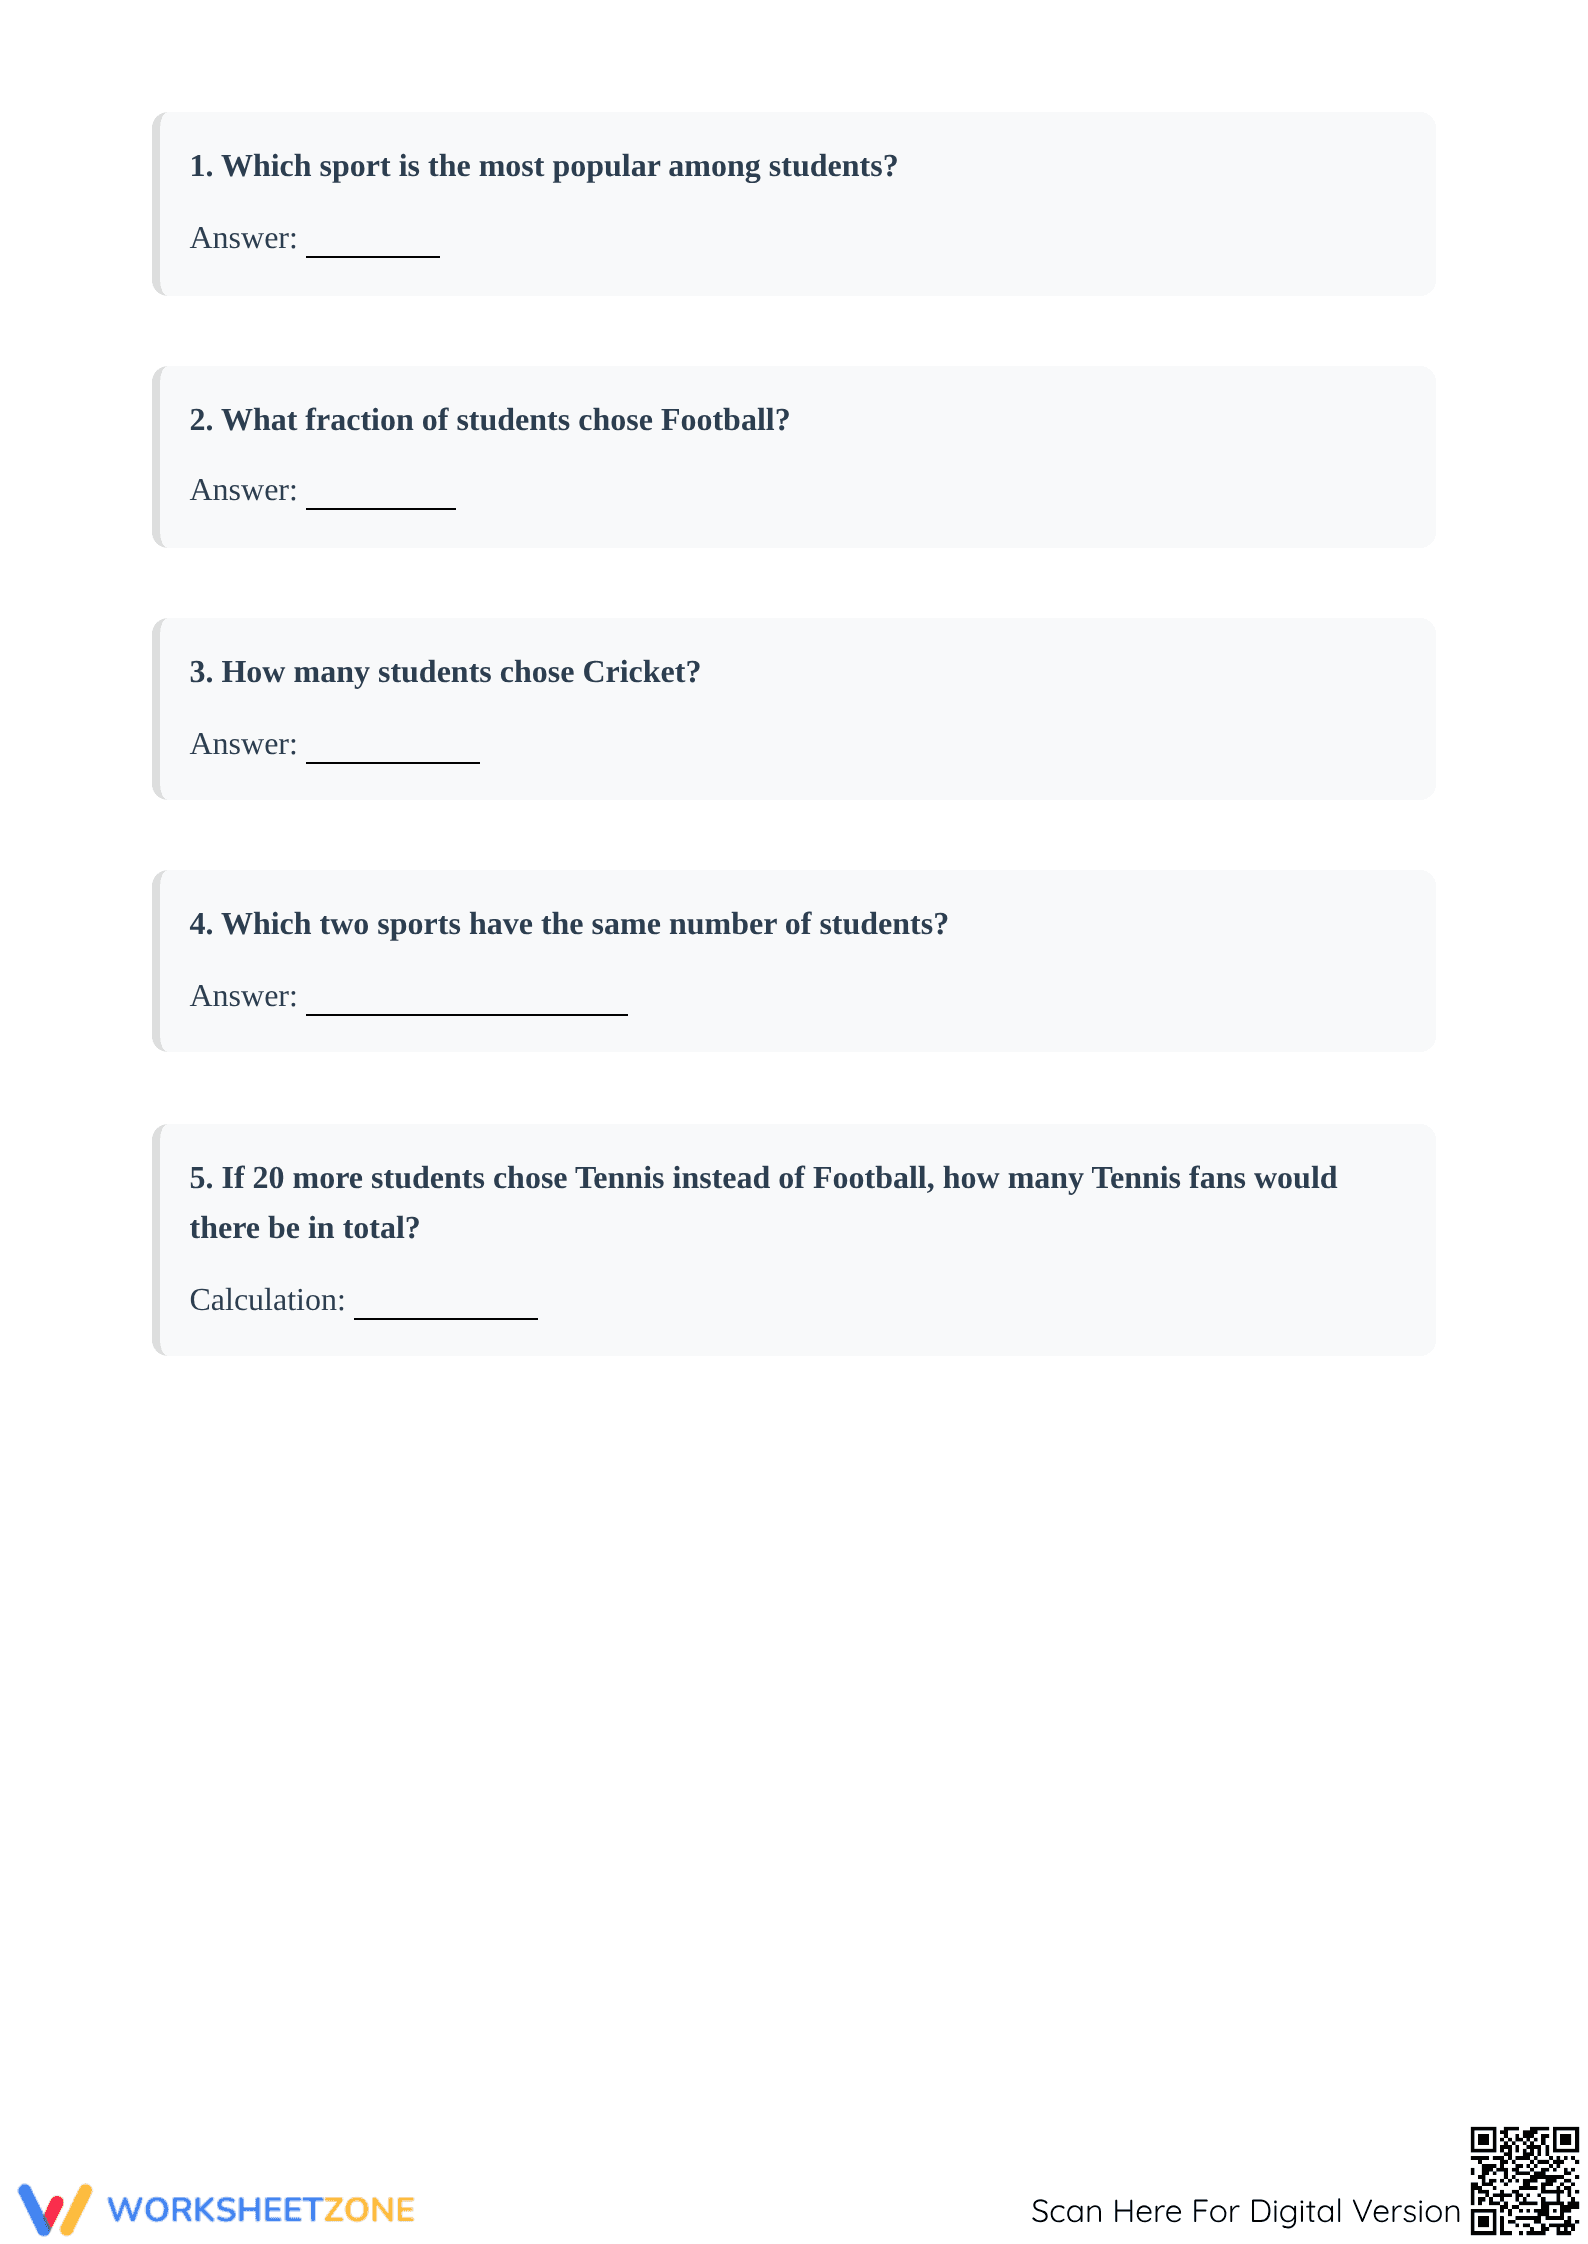
Inside this packet, you will find three distinct parts designed to build data literacy. Part 1 focuses on collecting and representing data, where students use a fruit sales table to complete a pictograph and a vertical bar chart. Part 2 moves into data analysis with targeted questions about frequency and comparisons. Part 3 introduces a complex sports survey pie chart, requiring students to interpret fractions and solve multi-step problems based on a 200-student sample size.
Skill Progression
- Guided Practice: Students receive a populated data table and pre-labeled chart frames to complete a pictograph (using a 1:5 scale) and a color-coded bar chart, focusing on accuracy in scaling.
- Supported Practice: Four analysis questions require students to compare data points (e.g., "How many more?") and calculate totals, moving from observation to calculation.
- Independent Practice: The final section challenges students to interpret a pie chart without a table, requiring them to identify popular categories and calculate specific values from a total population of 200.
This progression follows a gradual-release model, shifting students from the mechanical task of drawing charts to the cognitive demand of extracting meaning from complex visual data sets.
Standards Alignment
This resource is aligned to CCSS.MATH.CONTENT.4.MD.B.4, which requires students to represent and interpret data. While the standard specifically mentions line plots, this worksheet extends the requirement to pictographs, bar charts, and pie charts to ensure a well-rounded understanding of measurement and data domains. This standard code can be copied directly into lesson plans, IEP goals, or district curriculum mapping tools.
How to Use It
This worksheet is ideal for use after a direct instruction lesson on data types. Use Part 1 and 2 as a mid-lesson check to ensure students understand scaling (especially the 1:5 key in the pictograph). Part 3 can serve as an exit ticket or a challenge for early finishers. During instruction, observe if students correctly divide the 200-student total when interpreting the pie chart sections, as this reveals their fractional reasoning skills. Most Grade 4 students will complete the full set in 30 minutes.
Who It's For
This resource is designed for Grade 4 students but is highly effective for Grade 3 enrichment or Grade 5 review. It provides excellent support for English Language Learners (ELLs) through heavy visual scaffolding and clear headings. Pair this worksheet with a physical data-collection activity, such as a classroom vote, to bridge the gap between abstract charts and real-world data application.
Effective data handling instruction requires students to move beyond simple identification toward active construction and comparative analysis. This resource addresses the need for students to translate between data representations, a critical marker of mathematical fluency. By integrating multiple chart types into a single 4-page workflow, it prevents fragmented learning and encourages students to see data as a flexible tool for storytelling. Aligned to CCSS.MATH.CONTENT.4.MD.B.4, this printable ensures students can accurately display measurement data while building foundational logic for middle-school statistics and probability.


