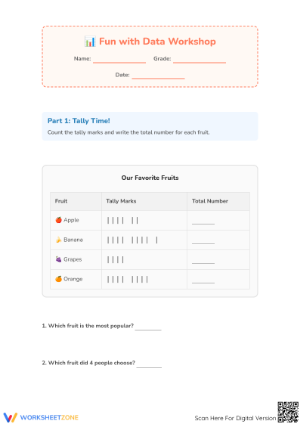
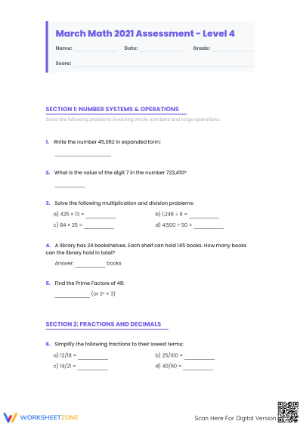
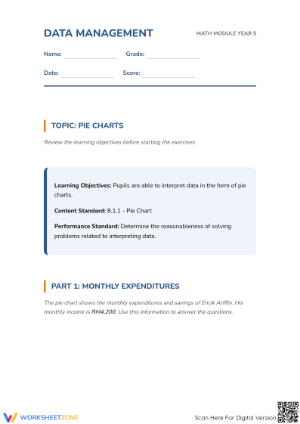
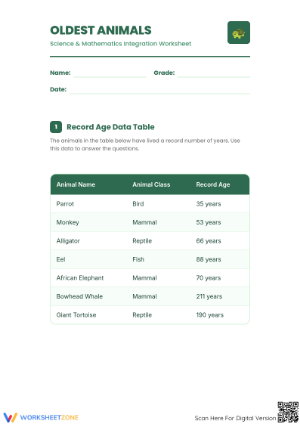
These 4th grade interpreting graphs printable worksheets resources address the central shift in Grade 4 data instruction: students are no longer just locating the tallest bar or counting symbols. They are performing operations on the data — calculating differences between categories, combining values to find totals, and drawing conclusions that require both graph-reading and arithmetic. Each worksheet presents a complete graph followed by questions that push students past surface-level reading into genuine analysis.
The Specific Skills These Worksheets Build
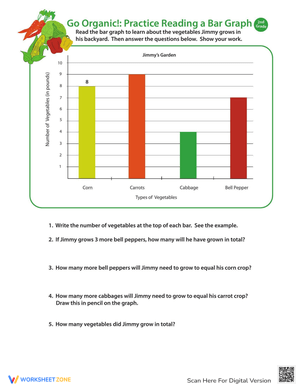
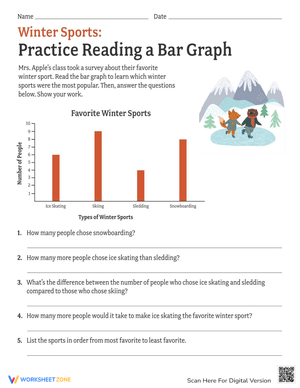
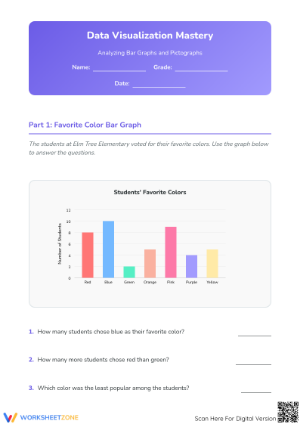
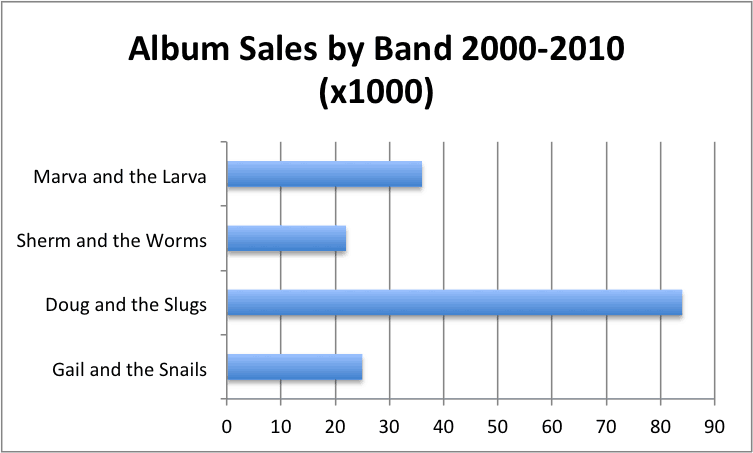
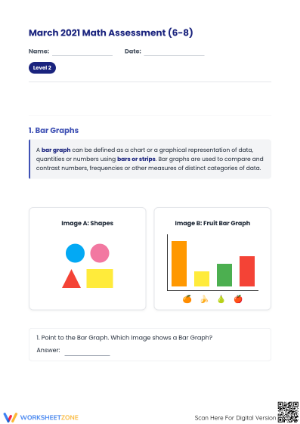
Bar graphs in this set use scales that count by 5s, 10s, 25s, and 50s, with bars that frequently land between gridlines. That in-between positioning is deliberate — it forces students to estimate and reason about partial intervals rather than simply reading a number off a marked line. Questions ask students to find the difference between the largest and smallest categories, which turns each worksheet into a subtraction problem embedded in a data context.
Line plots are the most technically demanding graph type in the set, and rightly so: CCSS.MATH.CONTENT.4.MD.B.4 requires students to work with measurement data recorded in halves, fourths, and eighths. Each line plot worksheet shows a number line marked with fractional intervals, a set of X marks representing individual measurements, and multi-step questions. Students might be asked to find the combined length of several items by adding the fractional values those marks represent — not simply counting how many marks appear at a given point on the number line.
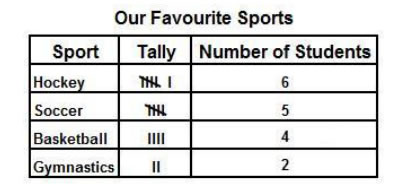
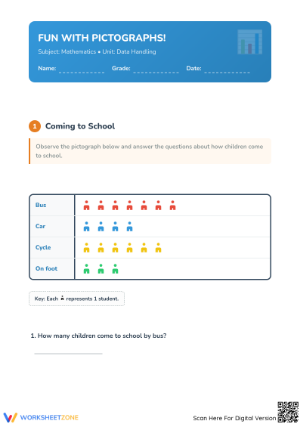
Pictograph worksheets use multiplicative keys — each symbol represents 5, 10, or 20 units — so students must apply multiplication and division to read the graph correctly. Questions move from basic retrieval ("how many books did the class read in March?") to comparative reasoning ("which two months combined equal the total for June?"), keeping the cognitive demand appropriate for Grade 4 without turning data work into a rote exercise.
Student Mistakes Worth Anticipating Before the Lesson
The most persistent error on line plot worksheets is confusing the count of X marks with the sum of their values. A student sees four X marks above the 3/4-inch mark and writes "4" as the answer to "what is the total length represented at this point?" — when the correct response is 3 inches (4 times 3/4). This is not a reading error; it is a conceptual one. Students have not yet internalized that each mark carries a value and that those values must be added or multiplied, not just tallied.
On bar graphs with scales counting by 25s, a bar that stops roughly three-fifths of the way between 50 and 75 gets read as 50 or 75 by students who snap to the nearest labeled interval instead of estimating within it. One fix: have students draw a small horizontal dashed line from the top of the bar to the y-axis before answering anything. That annotation forces them to see that the value lies between gridlines, not at one.
With pictographs, the most common mistake is writing the symbol count instead of the calculated value. A student counts three fish symbols and writes "3" when the key states each symbol equals 20 fish. This error appears even after whole-class discussion of the key, which points to a working memory issue during independent practice rather than a comprehension failure. Having students label each symbol with its numeric value directly on the graph — before answering any questions — reduces the error significantly and makes the calculation visible.
Standard Alignment
The line plot worksheets align directly with CCSS.MATH.CONTENT.4.MD.B.4, which requires students to create and interpret line plots displaying measurement data in fractional units — specifically halves, fourths, and eighths — and to solve addition and subtraction problems using that data. In classroom terms, this standard sits at the intersection of the measurement-and-data domain and the fractions domain, which means teachers address it most productively after students have some initial comfort with fractions on a number line but before fraction computation becomes its own unit focus. Placing these worksheets in that instructional window reinforces both skill areas at the same time without overloading either.
Bar graph and pictograph interpretation, while not carrying their own Grade 4 MD standard in CCSS, appear in state-level extensions and in the data-and-modeling strands of many curriculum frameworks. They also give students a meaningful arithmetic context: calculating differences between bar graph categories is multi-digit subtraction applied to a real question, not a naked computation problem.
How to Work These Worksheets Into Your Weekly Lesson Plans
The most consistent use teachers find for these worksheets is the five-minute warm-up at the start of the math block. One or two questions from a bar graph or pictograph worksheet — projected on the board or printed as a half-sheet — give students something to work on while attendance is taken and materials are distributed. Because the questions require real computation, this is not busy work. It is low-stakes retrieval practice on skills students have already encountered, and it primes their thinking for whatever the day's lesson covers.
As exit tickets, a three-question line plot worksheet tells you quickly who can perform operations on graph data and who is still in the "locate and report" phase. A student's written work makes the error visible — you can see whether they added fractional values or simply counted marks. Reviewing those responses before the following day's lesson takes about ten minutes and lets you form small re-teaching groups rather than re-teaching the whole class from scratch.
Using 4th grade interpreting graphs printable worksheets resources in math centers works well when you assign graph types by readiness level rather than by rotation schedule. Students still building bar graph confidence stay with those worksheets; students ready for fractional line plots move to that station. Each worksheet includes enough context that students can get started without waiting for teacher direction, which frees you to work with the group that needs the most support.
Differentiating These Worksheets Across Student Readiness Levels
Students who are still developing their fraction sense will find the line plot worksheets harder than their general math performance would predict. For those students, reduce the multi-step demand first — let them answer questions that ask for a single fractional value before moving to questions that require adding across multiple data points. Pairing the worksheet with a fraction number line reference strip gives them a visual anchor without changing the graph or the questions.
For students who move quickly through the standard questions, add a writing prompt: "What does this graph tell you that the numbers alone would not?" That shift from computation to interpretation catches the students who can calculate correctly but struggle to say what the data means in context. Students who write specific, evidence-based responses are demonstrating genuine data literacy; students who write "the data shows information" are telling you they need more practice with meaning-making, not just calculation mechanics.
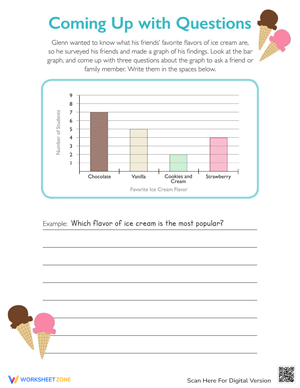
The 4th grade interpreting graphs printable worksheets set also serves students working above grade level. Give those students a completed graph and ask them to write three questions of varying difficulty for a partner to answer. Question-writing requires a deeper understanding of the graph's structure and scale than answering pre-written questions does, and it surfaces conceptual gaps that standard question-and-answer formats often miss.
Frequently Asked Questions
Which graph types are included, and how complex are the scales?
The set covers bar graphs, line plots, and pictographs. Bar graph scales use intervals of 5, 10, 25, and 50, with bars intentionally placed between gridlines to require estimation. Line plots use fractional units — halves, fourths, and eighths — in line with CCSS.MATH.CONTENT.4.MD.B.4. Pictograph keys assign values of 5, 10, or 20 units per symbol, requiring students to apply multiplication and division rather than direct counting.
Are these worksheets appropriate for homework assignments?
The 4th grade interpreting graphs printable worksheets resources work well as take-home assignments because each worksheet includes everything a student needs to answer the questions — no prior class discussion of that specific graph is required. Parents helping at home are not missing context that was only established in the classroom, which makes these cleaner homework choices than worksheets tied to a specific lesson's setup.
When in the year should I introduce the line plot worksheets?
Most teachers introduce line plots with fractional units mid-year, after students have had initial instruction on placing fractions on a number line. Using bar graph and pictograph worksheets earlier in the year lets students build graph-reading confidence and practice multi-digit arithmetic in a data context before the fractional complexity of line plots arrives. That sequencing means students are tackling the harder graph type with stronger foundational skills behind them.
How do these worksheets connect to fraction instruction?
Line plot worksheets in particular function as applied fraction practice. If students are working on adding fractions with like denominators, a line plot using eighths of an inch gives them the same operation in a data context — the calculation serves a real question rather than existing as an isolated drill. Pairing a line plot worksheet with fraction computation practice during the same instructional week reinforces both skills without doubling the lesson time.













 Interactive Worksheet Maker
 Quiz Maker
 Word Search Maker
 Crossword Puzzle Maker
 Word Scramble Generator
 Sentence Scramble Generator
 Handwriting Worksheet Generator
 Name Tracing Generator
 Fill In The Blank Generator