These weather and climate worksheets printable for 3rd grade put a clean, teachable distinction directly in students' hands: weather describes what the atmosphere is doing right now, and climate is the long-term pattern a region follows across years and seasons. That difference sounds straightforward until you watch a third grader classify a record-breaking blizzard as "climate" because it seems too significant to be a single day's observation. Each worksheet in the set addresses that confusion through sorting tasks, daily observation logs, short data work, and vocabulary practice grounded in real examples.
The Specific Skills Covered
Each worksheet focuses on one well-defined task so students are not splitting attention between figuring out what they're supposed to do and actually learning the science. The skills across the set include:
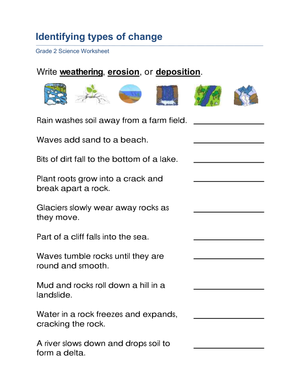
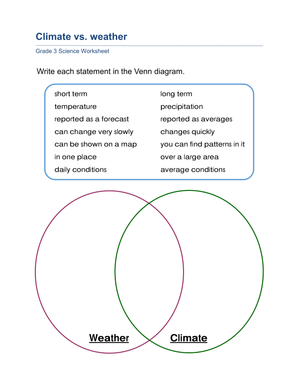
- Weather vs. climate sorting: Students read statements and decide whether each one describes a short-term atmospheric condition or a long-term regional pattern. The key language students learn to notice is words like usually, typically, or on average as signals of climate versus today, this morning, or right now as signals of weather.
- Daily observation recording: Students fill in a week-long chart using temperature words, cloud cover descriptions, precipitation type, and wind conditions. The worksheet includes a symbol key so students can record efficiently without writing full sentences each day.
- Bar graph reading and building: One worksheet gives students a partially completed graph of a week's weather types; another asks them to construct their own from collected class data and answer comparison questions about frequency.
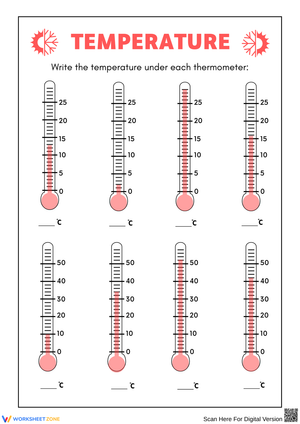
- Vocabulary in context: Each vocabulary worksheet places terms like precipitation, forecast, temperature, and season inside sentences and labeled images rather than in stand-alone definitions. Students match, complete, or identify — not just copy.
- Short informational reading: A passage-based worksheet presents a brief text about a region's typical conditions and asks students to distinguish between the weather described in a specific week and the broader climate pattern the passage describes.
Frequent Student Errors Worth Anticipating
The most consistent error in this unit is treating dramatic or memorable weather as climate. A student who hears "last summer was the hottest on record" will often sort that into climate — because it sounds like a big, lasting fact — even though it describes a single season's anomaly. The sorting worksheets address this directly by including statements that are emotionally weighted or phrased to sound significant. Watch for students who sort simple examples correctly ("It is sunny today") but misclassify compound ones like "Last winter was much colder than usual." The word usual in that sentence is actually a climate reference embedded in a weather description, and students need explicit instruction to notice the difference.
A second pattern shows up in graph work. Third graders frequently interpret the tallest bar as "the best" or "most important" weather type rather than simply the most frequent one. The graphing worksheet includes a question that asks students to explain what the tallest bar means without using any value language, which surfaces this thinking directly. A brief follow-up conversation about what a graph counts versus what we personally prefer is usually all it takes to redirect the reasoning.
Building These Worksheets Into Your Science Week
The observation log worksheet works best when launched on a Monday — five minutes before morning meeting, students record current conditions from the window or during an outdoor transition, and the class builds a shared data set through the week. By Thursday, students have real numbers to carry into the graphing worksheet, which makes the graph feel like a product of actual observation rather than a math exercise with invented numbers. This sequence is one of the clearest arguments for keeping weather and climate worksheets printable for 3rd grade available in hard copy: a paper log on the desk requires no device and no login, and students can carry it to the window without pulling up a browser.
For science centers, three-station rotations work well with this set. Station one holds the sorting worksheet alongside a small stack of additional example cards. Station two holds the vocabulary worksheet with a simple picture reference nearby. Station three holds the graphing worksheet using the week's class data posted on chart paper. Most third graders need 12 to 15 minutes per station, which fits a standard center block without rushing.
The reading passage worksheet sits best at either end of the unit. Used before direct instruction, it surfaces prior knowledge and shows you where students already carry accurate intuitions versus where they conflate the two concepts. Used after sorting and observation work, it functions as a low-stakes check on whether students can apply what they have learned to a new context — which is a more meaningful test than any review drill.
Differentiating the Set Across Learner Levels
Students who are still building reading fluency tend to do well with the sorting worksheet because the statements are short and the task is binary — weather or climate. For students who need additional support, a two-column reference card taped to the desk with one concrete example in each column keeps the guidance close without interrupting independent work. Students who have a strong conceptual grasp can extend the same worksheet by writing two original statements for a partner to sort, a task that requires more careful word choice than simply selecting between two columns.
The graphing worksheet has a natural extension step built in: after completing the printed questions, students write a prediction about what a similar graph might look like for the same location in a different season. That move shifts the task from reading data to applying climate knowledge, and it requires no additional materials.
The reading passage worksheet is the most format-dependent resource in the set. Students who struggle with informational text tend to answer questions based on surface wording — circling the phrase that mentions rain rather than reading the full sentence it appears in. A partner read or brief read-aloud before independent work usually improves response quality more than any modification to the worksheet itself. That is an honest limitation of passage-based formats at this age, and it is worth planning for rather than discovering mid-lesson.
Standard Alignment
These weather and climate worksheets printable for 3rd grade align to NGSS 3-ESS2-1, which asks third graders to represent data in tables and graphical displays to describe typical weather conditions expected during a particular season. The observation log and bar graph worksheets directly address that performance expectation — students collect, record, and display real weather data, then use it to identify patterns across the week. The sorting and vocabulary worksheets support NGSS 3-ESS2-2, which calls for students to obtain and evaluate information about typical weather conditions in different regions of the world. In most Grade 3 sequences, the ESS2 cluster appears mid-year, after students have practiced basic data collection in earlier units and are ready to begin comparing patterns across locations and seasons. These worksheets fit that instructional placement: they build the vocabulary and sorting reasoning students need before the more abstract cross-regional comparisons that appear later in the unit.
Frequently Asked Questions
Can these worksheets fit into the schedule outside a dedicated science block?
Yes. The observation log works during morning meeting or as a consistent warm-up in any reliable 5-minute window. The vocabulary worksheet functions as content-area reading practice and pairs naturally with a language arts block. The graphing worksheet connects directly to the third-grade math standard for reading and interpreting bar graphs, so it can move into math time during weeks when the science block is shortened by assemblies or testing schedules.
How long does each worksheet take for most third graders to complete independently?
Most worksheets in the set take between 10 and 18 minutes for students working without assistance. The observation log is an exception — students fill it in incrementally over several days rather than completing it in one sitting. The reading passage worksheet can run closer to 20 minutes for students who read slowly, so it is worth placing during a longer science or reading period rather than in the final few minutes before a transition.
Which worksheet works best as a formative check?
The sorting worksheet and the vocabulary worksheet both give clear, easy-to-read evidence of whether students can distinguish weather from climate and use key terms accurately. The graphing and observation worksheets reveal procedural skills more than conceptual understanding on their own, so adding a short written explanation item — "What does the tallest bar on your graph tell you about the week?" — raises their assessment value considerably. When you want a quick end-of-unit check, look for the weather and climate worksheets printable for 3rd grade that combine sorting with two or three written explanation items; that pairing shows you both identification accuracy and reasoning quality in under 15 minutes.
Are these worksheets accessible for English Language Learners?
The sorting and bar graph worksheets are the most accessible for ELL students because they depend on short text and visual formats rather than extended prose. The reading passage worksheet is the most language-dense resource in the set and benefits from vocabulary pre-teaching for students in early stages of English acquisition. The weather symbols on the observation log reduce the language barrier for daily recording, though students still developing sentence-level writing will likely need a sentence frame for any written summary section on that worksheet.