


Views
Downloads
Grade 3 Climate vs. Weather — Essential No-Prep Worksheet
Paste this activity's link or code into your existing LMS (Google Classroom, Canvas, Teams, Schoology, Moodle, etc.).
Students can open and work on the activity right away, with no student login required.
You'll still be able to track student progress and results from your teacher account.
Mastering Weather vs. Climate
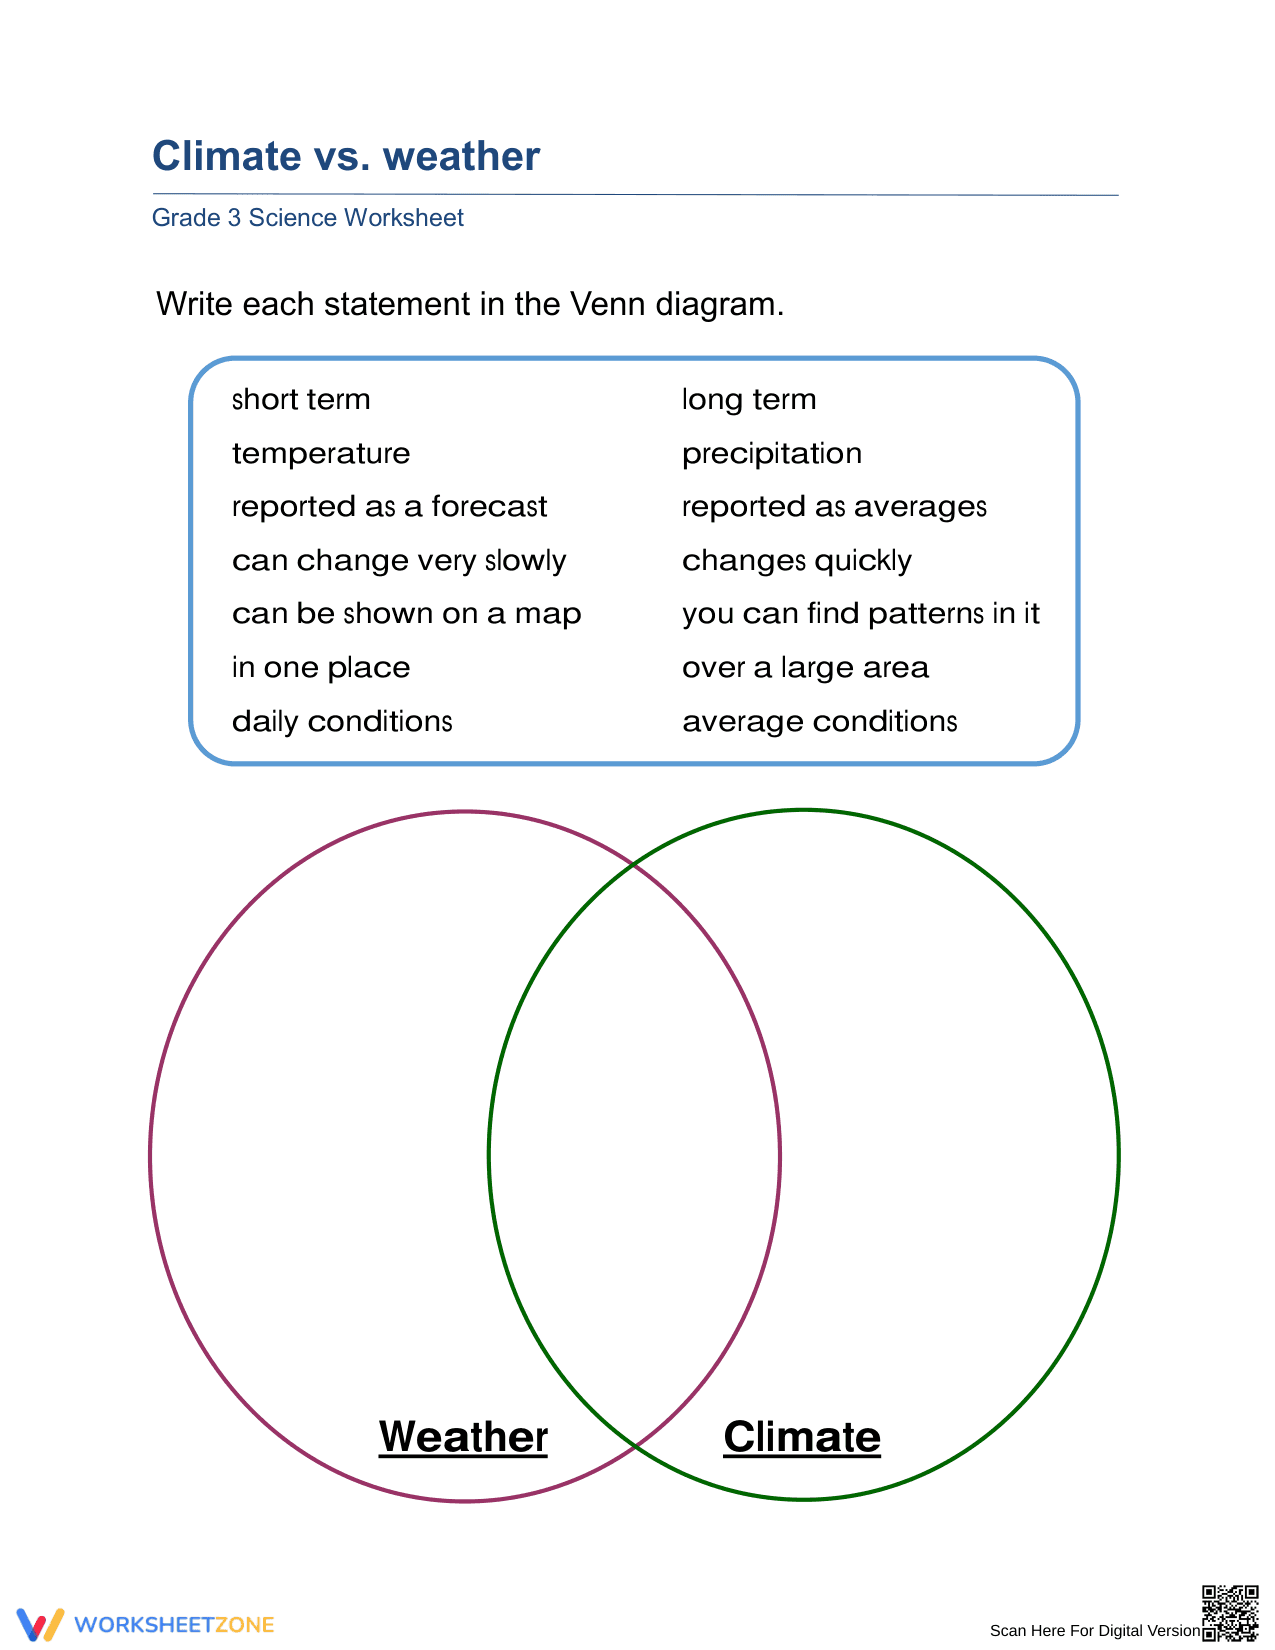
Distinguishing between weather and climate is a foundational concept in Earth Science. This worksheet helps students master this distinction by analyzing 14 specific characteristics and placing them into a Venn diagram. By the end of this activity, students will clearly understand that weather refers to short-term conditions while climate represents long-term averages.
At a Glance
- Grade: 3 · Subject: Science
- Standard:
3-ESS2-1— Represent data in graphical displays to describe typical weather conditions- Skill Focus: Comparing weather and climate
- Format: 2 pages · 14 problems · Answer key included · PDF
- Best For: Independent practice or quick formative assessment
- Time: 15–20 minutes
What's Inside
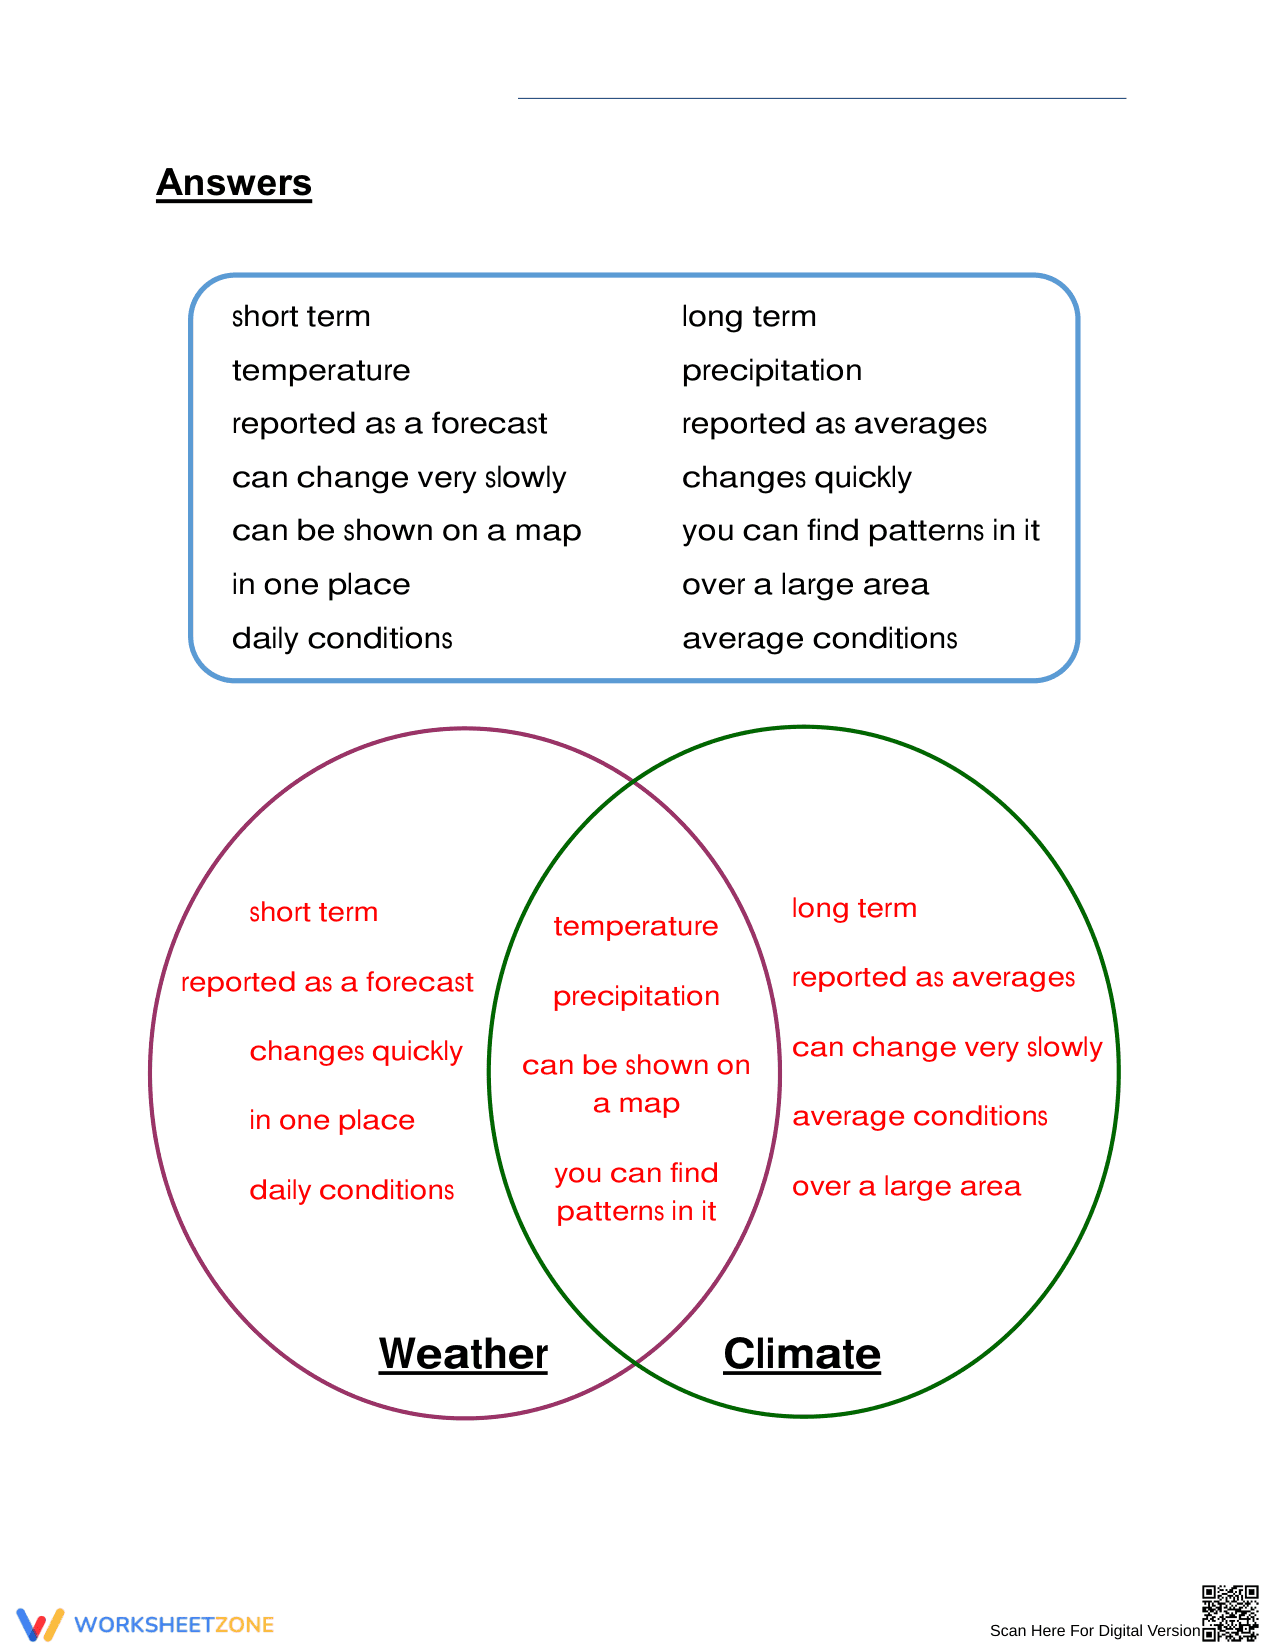
The worksheet features a clear, dual-circle Venn diagram labeled "Weather" and "Climate." A provided word bank contains 14 statements ranging from "short term" and "reported as a forecast" to "long term" and "average conditions." The two-page PDF includes a student worksheet and a corresponding teacher answer key, ensuring a complete instructional cycle from distribution to grading.
Zero-Prep Workflow
- Print: Generate copies for your entire class in under 30 seconds.
- Distribute: Pass out the single-page activity for immediate student engagement.
- Review: Use the included answer key for a rapid 2-minute class discussion or grading session.
Standards Alignment
This activity is specifically aligned to 3-ESS2-1: "Represent data in tables and graphical displays to describe typical weather conditions expected during a particular season." By categorizing atmospheric traits, students develop the organizational skills necessary to interpret complex meteorological data sets. This standard code can be copied directly into lesson plans, IEP goals, or district curriculum mapping tools.
How to Use It
Use this worksheet as a formative assessment after an introductory lesson on the atmosphere. During the activity, circulate the room to observe if students correctly associate "averages" with climate and "forecasts" with weather. This provides immediate insight into their conceptual understanding. It also serves as an excellent individual check-for-understanding before moving into regional climate studies.
Who It's For
While designed for 3rd-grade students, the visual nature of the Venn diagram makes this resource highly accessible for English Language Learners (ELL) and students requiring additional scaffolding. It pairs naturally with a weather station observation project or an anchor chart displaying local seasonal patterns. The clear font and structured layout support students with varied processing speeds.
Scientific literacy in the elementary years requires students to move beyond simple observations toward categorized conceptual models. According to a ScienceDirect TpT Analysis, structured graphic organizers like Venn diagrams significantly improve long-term retention of scientific definitions by requiring active cognitive sorting rather than passive reading. This Grade 3 resource leverages that principle, providing a clear pathway for students to internalize the critical difference between daily meteorological changes and long-term climatic patterns. By requiring students to handle 14 distinct data points, the worksheet meets the rigor demanded by modern science standards while maintaining an accessible format for young learners. The inclusion of a comprehensive answer key further supports the instructional framework, allowing for immediate feedback—a key component in the mastery of Earth Science concepts. This document serves as a reliable instrument for measuring student progress against 3-ESS2-1 benchmarks, ensuring students can accurately distinguish weather from climate.