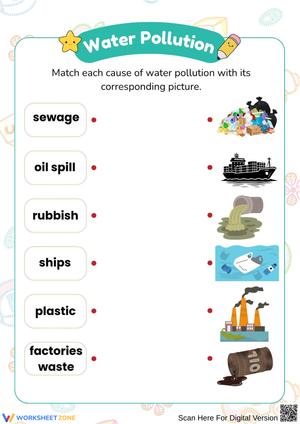
These water printable worksheets for 3rd grade cover the water cycle, states of matter, and Earth's freshwater distribution — the three pillars of every third-grade Earth science unit worth its salt. Each worksheet is downloadable and ready to drop into a lesson, a science station rotation, or a Friday review block without prep beyond printing.
Concepts and Skills Each Worksheet Addresses
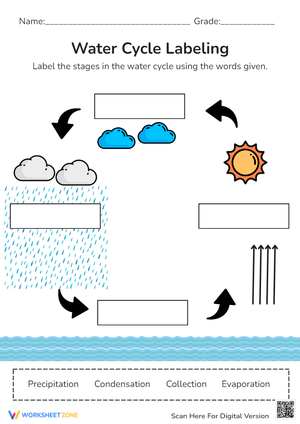
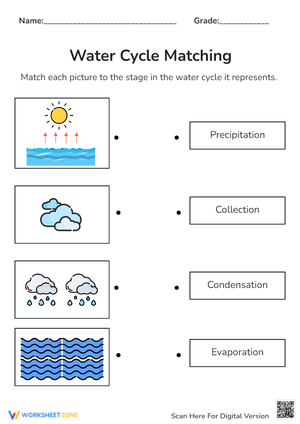
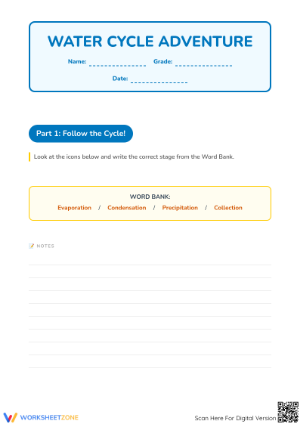
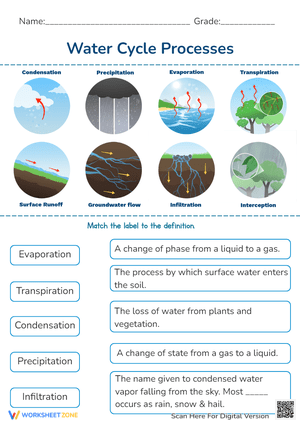
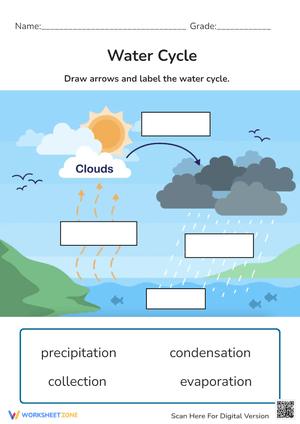
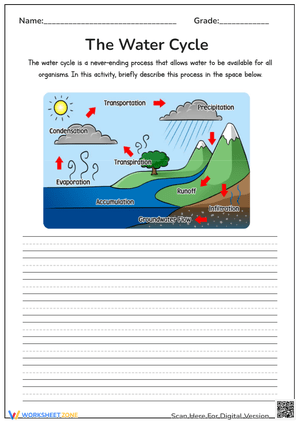
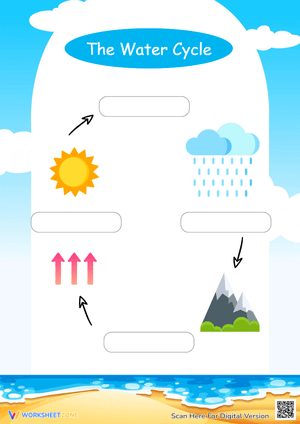
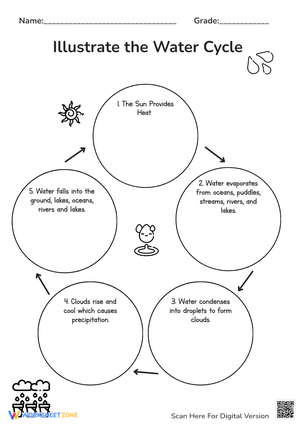
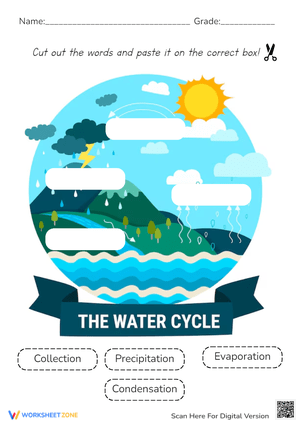
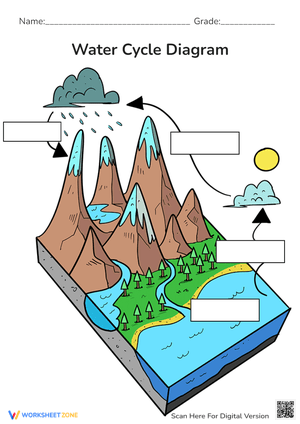
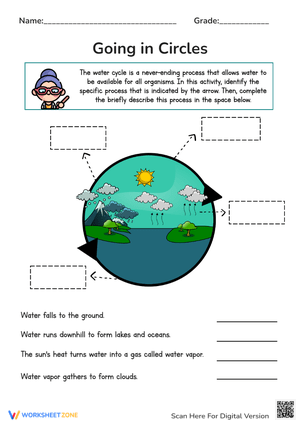
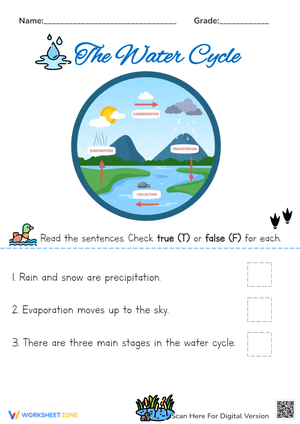
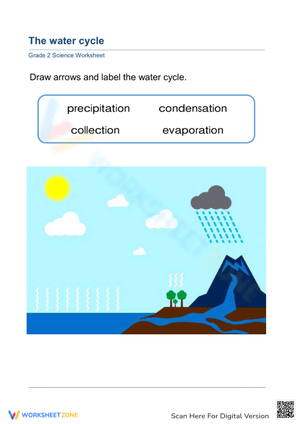
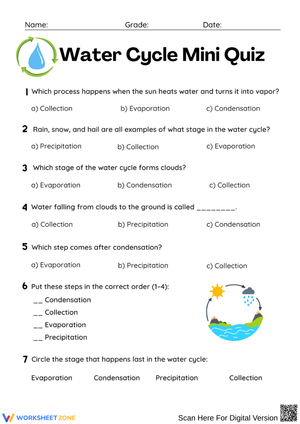
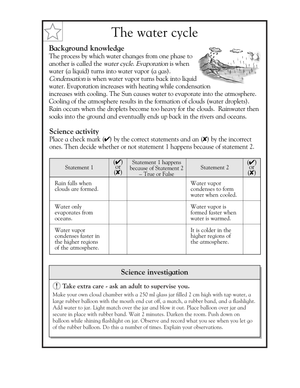
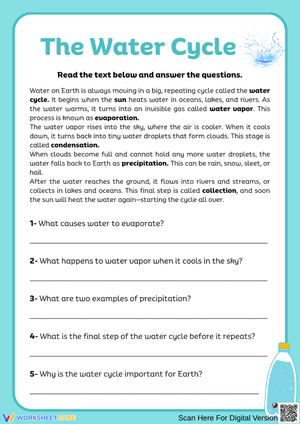
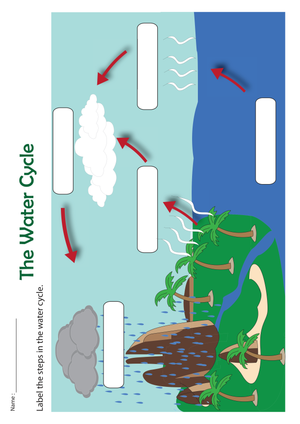
The water cycle worksheets move through the process in concrete, stage-by-stage steps. Students label diagram arrows, match vocabulary to definitions, and fill in process sequences for evaporation, condensation, precipitation, and collection. One worksheet focuses entirely on the visual logic of the cycle — students draw the path a single water molecule takes from an ocean surface through the atmosphere and back to a river — which forces them to sequence the stages rather than just recognize them out of order from a labeled bank.
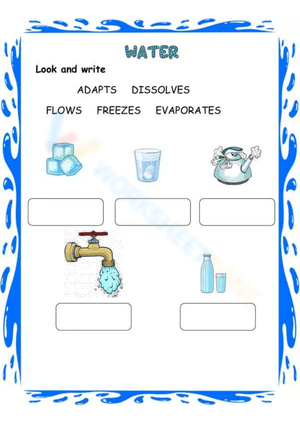
A separate group of worksheets targets the three states of matter through sorting tasks and observation logs. Students categorize examples — ice cap, steam from a kettle, a puddle — by state, then explain what temperature change caused each transition. The recording format mirrors what students encounter on unit assessments: a two-column table asking them to name the process and identify the energy change involved. That format repetition is deliberate; familiarity with the table structure lowers the stakes when the same layout shows up on a quiz.
Earth's water distribution gets its own worksheet built around an unlabeled pie chart. Students fill in the saltwater-freshwater split, then break the freshwater portion further into glaciers, groundwater, and surface water. That third tier of the breakdown is where most instruction stops short — and where this worksheet pushes a little further than the textbook diagram usually does.
Mistakes Students Make That These Worksheets Help You Catch
The most consistent error in third-grade water cycle work is students treating condensation and precipitation as interchangeable. They understand clouds form from water vapor, and they know rain falls — but written responses frequently show "condensation" next to a rain arrow and "precipitation" next to a cloud image. The diagram exercises in this set place both labels on the same worksheet, forcing a side-by-side distinction rather than letting students guess each term in isolation.
A subtler problem appears in the states-of-matter work. Students who correctly sort ice as solid and steam as gas still write that evaporation makes water "disappear." They haven't yet internalized that the water remains water — just invisible. The observation logs address this directly by asking students to trace what happened to the water left overnight in a small dish on a windowsill. The answer box is narrow on purpose, pushing students toward a concise scientific explanation rather than a story.
Building These Worksheets Into Your Science Unit
The water cycle diagram worksheets work best as guided activities early in a lesson, before notes close. Hand one out before the full class discussion and have students fill in what they already believe is true. After the lesson, they revise their answers in a second color. That before-and-after structure turns the worksheet into a visible thinking record — students and teachers both see exactly where prior knowledge was accurate and where it needed to shift. Compared to a plain end-of-lesson exit slip, this approach makes the learning process itself visible.
The states-of-matter observation logs pair naturally with a simple classroom demonstration: a clear plastic cup with ice, watched for condensation forming on the outside. Students record what they observe in real time. Without the worksheet, that observation floats away in five minutes. With it, students have a written record to reference when a test prompt asks them to explain why a cold glass gets wet on the outside on a humid day.
For the water distribution pie chart worksheet, the five minutes before students line up for lunch is enough time. It's low-stakes, requires nothing but a pencil, and gives you a fast check on who absorbed the numerical proportions from the lesson. If most of the class fills in the saltwater percentage correctly but leaves the glaciers-versus-groundwater breakdown blank, that's tomorrow's warm-up, not a new lesson to plan.
Adjusting These Worksheets for a Range of Learners
The water printable worksheets for 3rd grade in this set give you enough variety to differentiate without building parallel materials from scratch. For students who struggle with vocabulary retention, printing the word bank worksheet alongside any diagram-labeling activity provides the language they need without removing the cognitive work of matching terms to processes. They still have to read each definition and make a decision — the word bank removes the recall burden, not the reasoning.
Students who finish quickly benefit from the open-ended extension prompts at the bottom of several worksheets in the set. One asks students to explain why a coastal city still faces freshwater shortages — a question that pulls together the full unit and requires more than recall. That same prompt works well as a written-response option for students whose science comprehension runs ahead of their fluency but who need more practice turning knowledge into organized sentences.
Standard Alignment
These water printable worksheets for 3rd grade align with NGSS 2-ESS2-3, which asks students to obtain information identifying where water is found on Earth and recognize that it can exist as solid or liquid. The standard is coded at second grade, but the third-grade classroom is where most teachers formally introduce the complete water cycle because the NGSS 3–5 band for ESS2.C — Earth's Systems — requires students to describe the roles of evaporation and precipitation in a cycling system. The diagram and labeling worksheets address that band-level expectation directly. The states-of-matter worksheets also connect to 2-PS1-1, which asks students to plan and conduct investigations on properties of matter, making the set cross-cutting between the Earth science and physical science strands of the curriculum.
Frequently Asked Questions
Do these worksheets work as stand-alone practice, or do they need to follow a specific lesson?
Most worksheets in the set function as independent practice after initial instruction — students need some exposure to the vocabulary before the diagram labeling makes sense. The observation logs are the exception; they're meant to be used during an activity, functioning as both recording tool and instruction simultaneously. A few worksheets include brief reference sections at the top so students who missed a class can still access the material without a full re-teach.
How long does each worksheet take to complete?
Most run between eight and fifteen minutes for on-level students. The pie chart worksheet is shorter — closer to six minutes — because it's a close-reading data task more than a writing task. The observation logs take longer if students are doing the accompanying experiment in real time, but the recording portion alone sits around ten minutes. Budget accordingly when you're fitting these into a 30-minute science block.
Are these appropriate for students who read below grade level?
The set uses controlled vocabulary throughout, with definitions embedded inside the task instructions rather than in a separate glossary students have to flip back to. The visual-heavy worksheets — particularly the water cycle diagrams — require minimal reading and work well for students whose science understanding outpaces their reading fluency. For students who need extra support with written response prompts, the word bank worksheet serves as a useful reference. These water printable worksheets for 3rd grade were built with the understanding that science vocabulary is already a significant load in itself — the instructions don't add to it unnecessarily.












 Interactive Worksheet Maker
 Quiz Maker
 Word Search Maker
 Crossword Puzzle Maker
 Word Scramble Generator
 Sentence Scramble Generator
 Handwriting Worksheet Generator
 Name Tracing Generator
 Fill In The Blank Generator