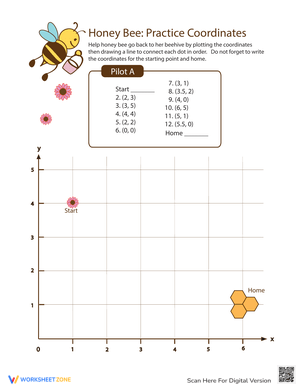
When you search for data worksheets, you are usually trying to solve a sequencing problem, not just find printable pages. Elementary data and graphing skills build in a specific order, and handing a Grade 3 class the wrong complexity level of graph can stall a lesson before it starts. The most useful data worksheets are the ones matched to where your students sit in the Measurement and Data progression, from simple sorting through scaled bar graphs and line plots.
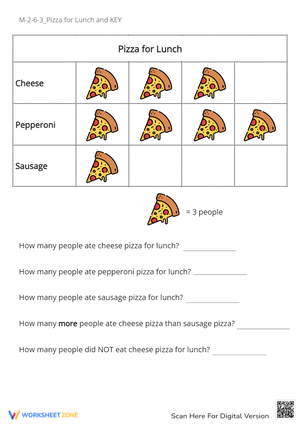
CCSS.MATH.CONTENT.1.MD.C.4 places Grade 1 students at pictographs with up to three categories, while CCSS.Math.Content.3.MD.B.3 has Grade 3 students reading scaled picture graphs and bar graphs and solving one- and two-step comparison problems from them. That is a real jump in numerical reasoning across just two grade levels, and it is why a single worksheet set rarely serves an entire K-3 team.
Grade 1: Single-Unit Pictographs as the Entry Point
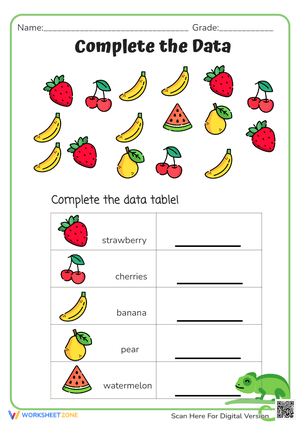
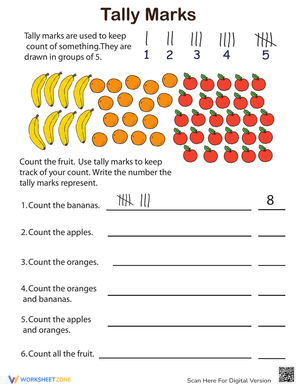
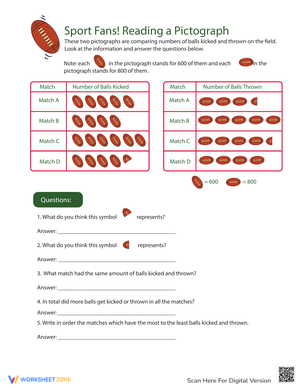
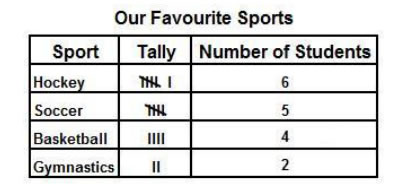
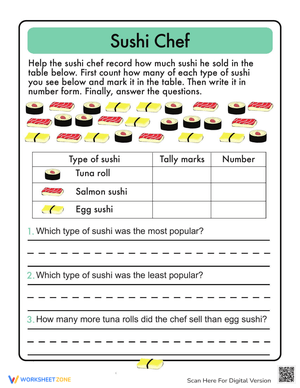
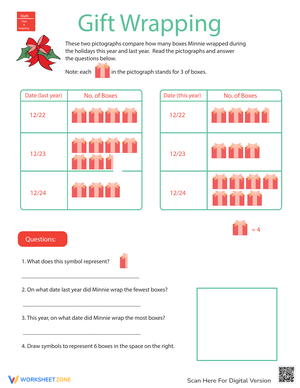
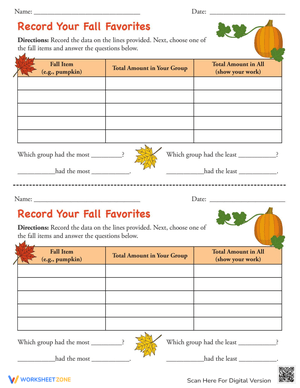
In Grade 1, data worksheets should stay close to concrete counting. Students organize, represent, and interpret data with up to three categories using pictographs, per CCSS.MATH.CONTENT.1.MD.C.4. Each picture or symbol on the graph equals one, so students are not yet asked to multiply or scale their thinking. A worksheet that asks students to tally favorite fruits, then transfer those tallies into a one-symbol-per-count pictograph, sits squarely in this standard.
Keep the categories short. Three categories is the ceiling named in the standard, so worksheets with four or five options push past what Grade 1 students are expected to handle independently. If you find a data worksheet with more categories, it is better suited for review with your strongest Grade 1 readers or as a bridge activity heading into Grade 2.
Grade 2: Adding Categories and Comparison Problems
CCSS.MATH.CONTENT.2.MD.D.10 moves students to drawing single-unit-scale picture graphs and bar graphs for up to four data categories, and it requires them to solve put-together, take-apart, and compare problems using the data shown. This is where data worksheets start doing double duty: they teach graph construction and they teach the word-problem structures that show up throughout Grade 2 math.
A strong Grade 2 worksheet sequence starts with a blank graph template and a data set for students to plot, then follows with graphs already drawn and a set of comparison questions like how many more or how many fewer. Separating construction practice from interpretation practice lets you see exactly where a student is struggling: are they misreading the graph, or are they unsure how to set up the comparison?
Grade 3: Scaled Graphs and Two-Step Reasoning
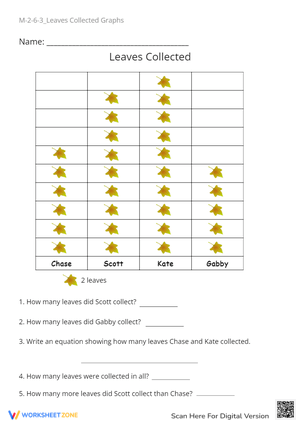
Grade 3 is the standard that most changes what a data worksheet needs to include. CCSS.Math.Content.3.MD.B.3 moves students from single-unit graphs to scaled picture graphs and bar graphs, where each symbol or bar increment might represent 2, 5, or 10 units instead of 1. Students are also expected to solve one- and two-step how-many-more and how-many-less problems using the scaled data, which means the graphing skill and the problem-solving skill have to be practiced together, not in isolation.
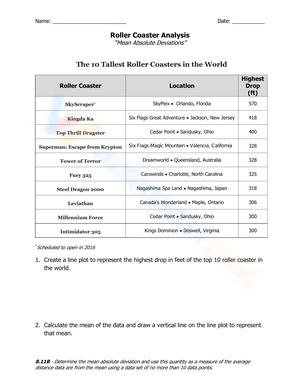
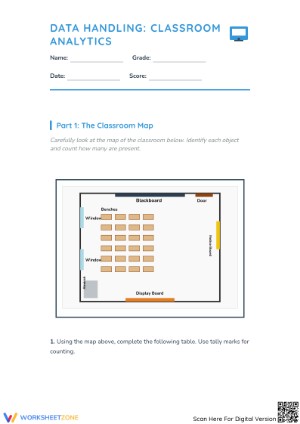
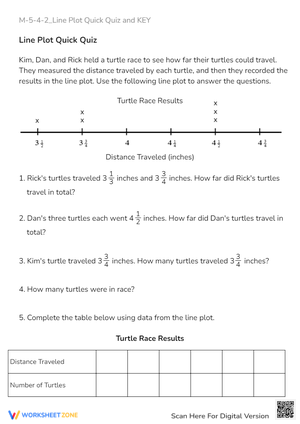
Grade 3 Measurement and Data standards also introduce generating measurement data and creating line plots to display it, so your worksheet rotation for this grade should include at least one unit built around measuring objects in the classroom, recording the data, and plotting it on a line plot with fractional units. This connects graphing directly to the measurement strand rather than treating data as a stand-alone topic.
Classroom Implementation
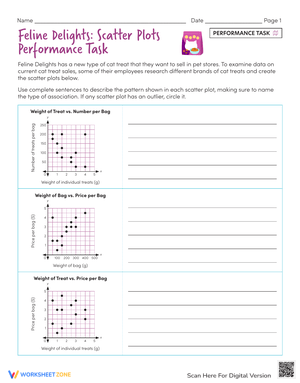
The most effective way to use data worksheets is to start with a real data collection activity before assigning any printable page. Have the class generate its own data set, whether that is favorite recess activities, pencil lengths measured in inches, or weather observations tracked over two weeks. Then hand out worksheets that ask students to represent that same type of data on a pictograph, bar graph, or line plot matched to their grade-level standard. Students engage more with graphing questions when the data feels like theirs rather than an anonymous data set printed on a page.
For small-group intervention, pull students who are still working with single-unit scales even if their grade-level peers have moved to scaled graphs. A Grade 3 student who has not consolidated single-unit bar graph reading will struggle more with scaled versions, so stepping back to a Grade 2-level worksheet for a session or two often accelerates progress rather than slowing it down. Pair that intervention worksheet with a slightly more complex one so the student has a clear next step once the foundational skill is solid.
Frequently Asked Questions
1. What grade level should introduce bar graph worksheets versus pictograph worksheets
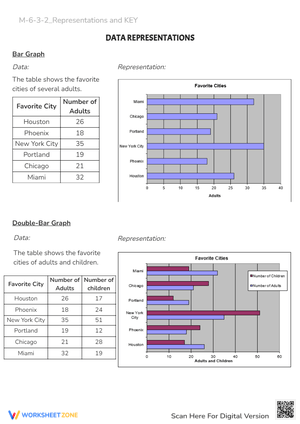
Grade 1 worksheets should focus on pictographs with up to three categories under CCSS.MATH.CONTENT.1.MD.C.4. Grade 2 introduces both picture graphs and bar graphs at a single-unit scale for up to four categories under CCSS.MATH.CONTENT.2.MD.D.10, and Grade 3 moves both graph types to a scaled format under CCSS.Math.Content.3.MD.B.3.
2. How do scaled bar graphs differ from single-unit bar graphs in CCSS standards
In a single-unit bar graph, each unit of height or length equals one data point, which is the expectation in Grade 2. In a scaled bar graph, introduced in Grade 3, each unit can represent a value like 2, 5, or 10, so students must multiply or skip-count to read the graph accurately.
3. How can teachers use data worksheets for formative assessment
Short worksheets with both direct-count and comparison questions work well as quick checkpoints between lessons. Comparison questions in particular reveal whether students are interpreting the graph correctly rather than estimating from its visual size.
4. What is the best way to sequence data and graphing worksheets across a unit
Start with real classroom data collection, move into worksheet practice for graph construction, then follow with interpretation and comparison questions. This mirrors the CCSS progression from representing data to solving put-together, take-apart, and compare problems with it.
5. How do line plots fit into the data and graphing worksheet progression
Line plots are introduced in Grade 3 alongside scaled bar graphs, connected to generating measurement data. Worksheets that pair a measuring activity, such as recording object lengths, with plotting that data on a line plot reinforce both the measurement and data strands together.













 Interactive Worksheet Maker
 Quiz Maker
 Word Search Maker
 Crossword Puzzle Maker
 Word Scramble Generator
 Sentence Scramble Generator
 Handwriting Worksheet Generator
 Name Tracing Generator
 Fill In The Blank Generator