Attention everyone: a new case has just arrived at the lab, and we need your best detective skills to solve it! There is a hidden world of information inside this stem and leaf plot worksheets file, but it is locked behind a series of puzzles and secret clues about numerical distribution. Are you brave enough to take on this mission and find out the truth that is hidden inside the page? This isn't just a regular lesson; it is a top-secret investigation into a new subject, and we need you to help us crack the code today during your math study.
Your main tool for this quest is a set of specialized pages that were made to test how well you can spot a hidden detail in a data set or a frequency table. As you work through the mystery, you will need to keep your eyes open for the small clues about outliers and medians that other people might miss. Every choice of number or pattern brings us one step closer to finishing the mission and uncovering the secret of statistical elegance. When students treat their work like a high-stakes investigation, they develop a level of focus today effectively.
The path through this inquiry is full of twists and turns, but the feeling of finally finding the answer is worth the effort. Every line on the page is a clue, and every blank space is a puzzle that is waiting for your solution. Will you follow the trail to see where it leads, or will you stay on the surface? The power to solve the case is in your hands as you cross the line from being a student to being a real explorer of quantitative narratives today. Explore our interactive data blog for more magical inspiration today.
Teachers can use these investigation sheets to bring a sense of adventure to even the most standard statistical subjects. By framing the practice as a mission rather than a chore, you immediately raise the engagement levels in the room. I find that even the most reluctant learners get excited when they are given a top-secret task to complete. It is a fantastic way to turn a quiet study block into a time of active discovery and high-level thinking for every student. Our coordinate planes hub offers more clues for your mission today.
The case is waiting for a brilliant mind like yours to crack it wide open using những stem and leaf plot worksheets clues. Don't let the mystery stay unsolved; get your tools ready and prepare to find out the secrets that are waiting for you at Worksheetzone. The files are declassified, the clues are out there, and the world is waiting to see if you can find the truth. Your mission starts the second you pick up your pencil; let's see if you have what it takes to bring the answers to light during your next math session effectively!
Frequently Asked Questions
Question 1: What is the primary statistical focus of using stem and leaf plot worksheets?
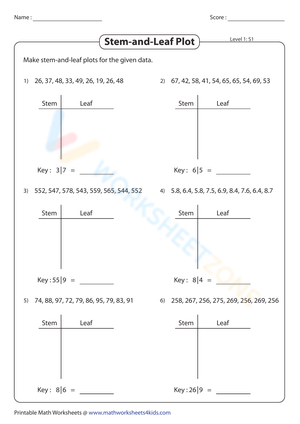
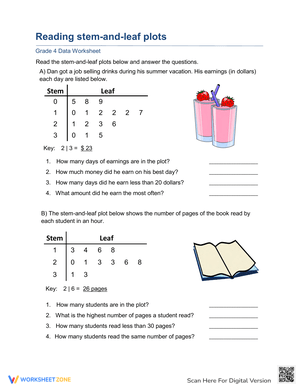
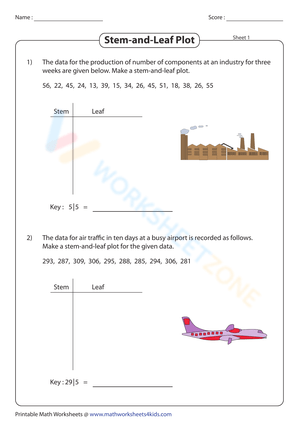
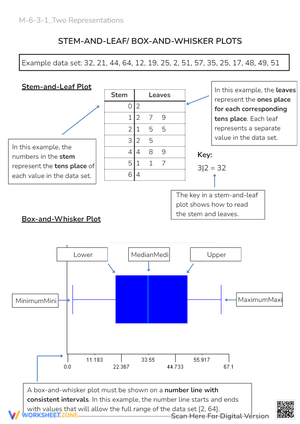
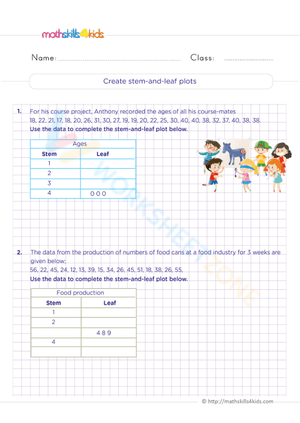
Our stem and leaf plot worksheets focus on teaching students to organize and display numerical data while preserving the individual values in a set. Through detailed labeling and analysis, learners identify the "stem" (leading digits) and "leaf" (last digits) to see the shape of a distribution. This foundational knowledge is essential for understanding descriptive statistics, providing a high degree of mathematical literacy that meets the rigorous standards of modern curricula effectively today during school sessions.
Question 2: How can stem and leaf plot worksheets help students identify outliers?
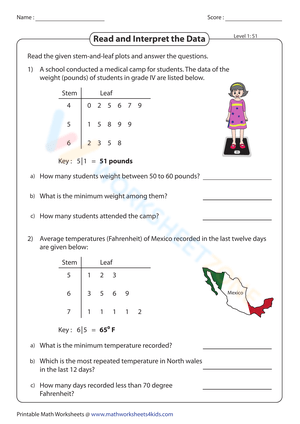
By organizing data in a vertical stack through our stem and leaf plot worksheets, students can easily spot values that fall far outside the typical range. The activities encourage learners to visualize the spread and center of a data set, building the analytical awareness required for more advanced math and science topics. This hands-on analysis ensures that students are not just plotting points, but are actually grasping the fundamental mechanisms of data interpretation throughout their academic journey effectively.
Question 3: Are these stem and leaf plot worksheets suitable for various elementary and middle school grades?
Yes, we have designed stem and leaf plot worksheets with varying levels of complexity to support all the learners in your care. Some sheets focus on small data sets for introductory lessons, while others include large sets with three-digit numbers for refined control and analysis. Providing these accessible resources helps students feel successful and proud of their results, building their creative confidence from a very young age during any week of school today effectively at Worksheetzone today.
Question 4: What is the best way to print these high-resolution PDF files at Worksheetzone?
We recommend using a high-quality printer setting to ensure that every numerical symbol, title box, and key is preserved for your students. These stem and leaf plot worksheets are provided in high-resolution PDF format, making them compatible with any standard school printer and operating system. Simply download the packs from Worksheetzone and you will have professional-grade materials ready to inspire your young heroes in under a minute today effectively, reclaiming your valuable prep time.