


Views
Downloads

Grade 4 Data Handling — Printable No-Prep Worksheet
Paste this activity's link or code into your existing LMS (Google Classroom, Canvas, Teams, Schoology, Moodle, etc.).
Students can open and work on the activity right away, with no student login required.
You'll still be able to track student progress and results from your teacher account.
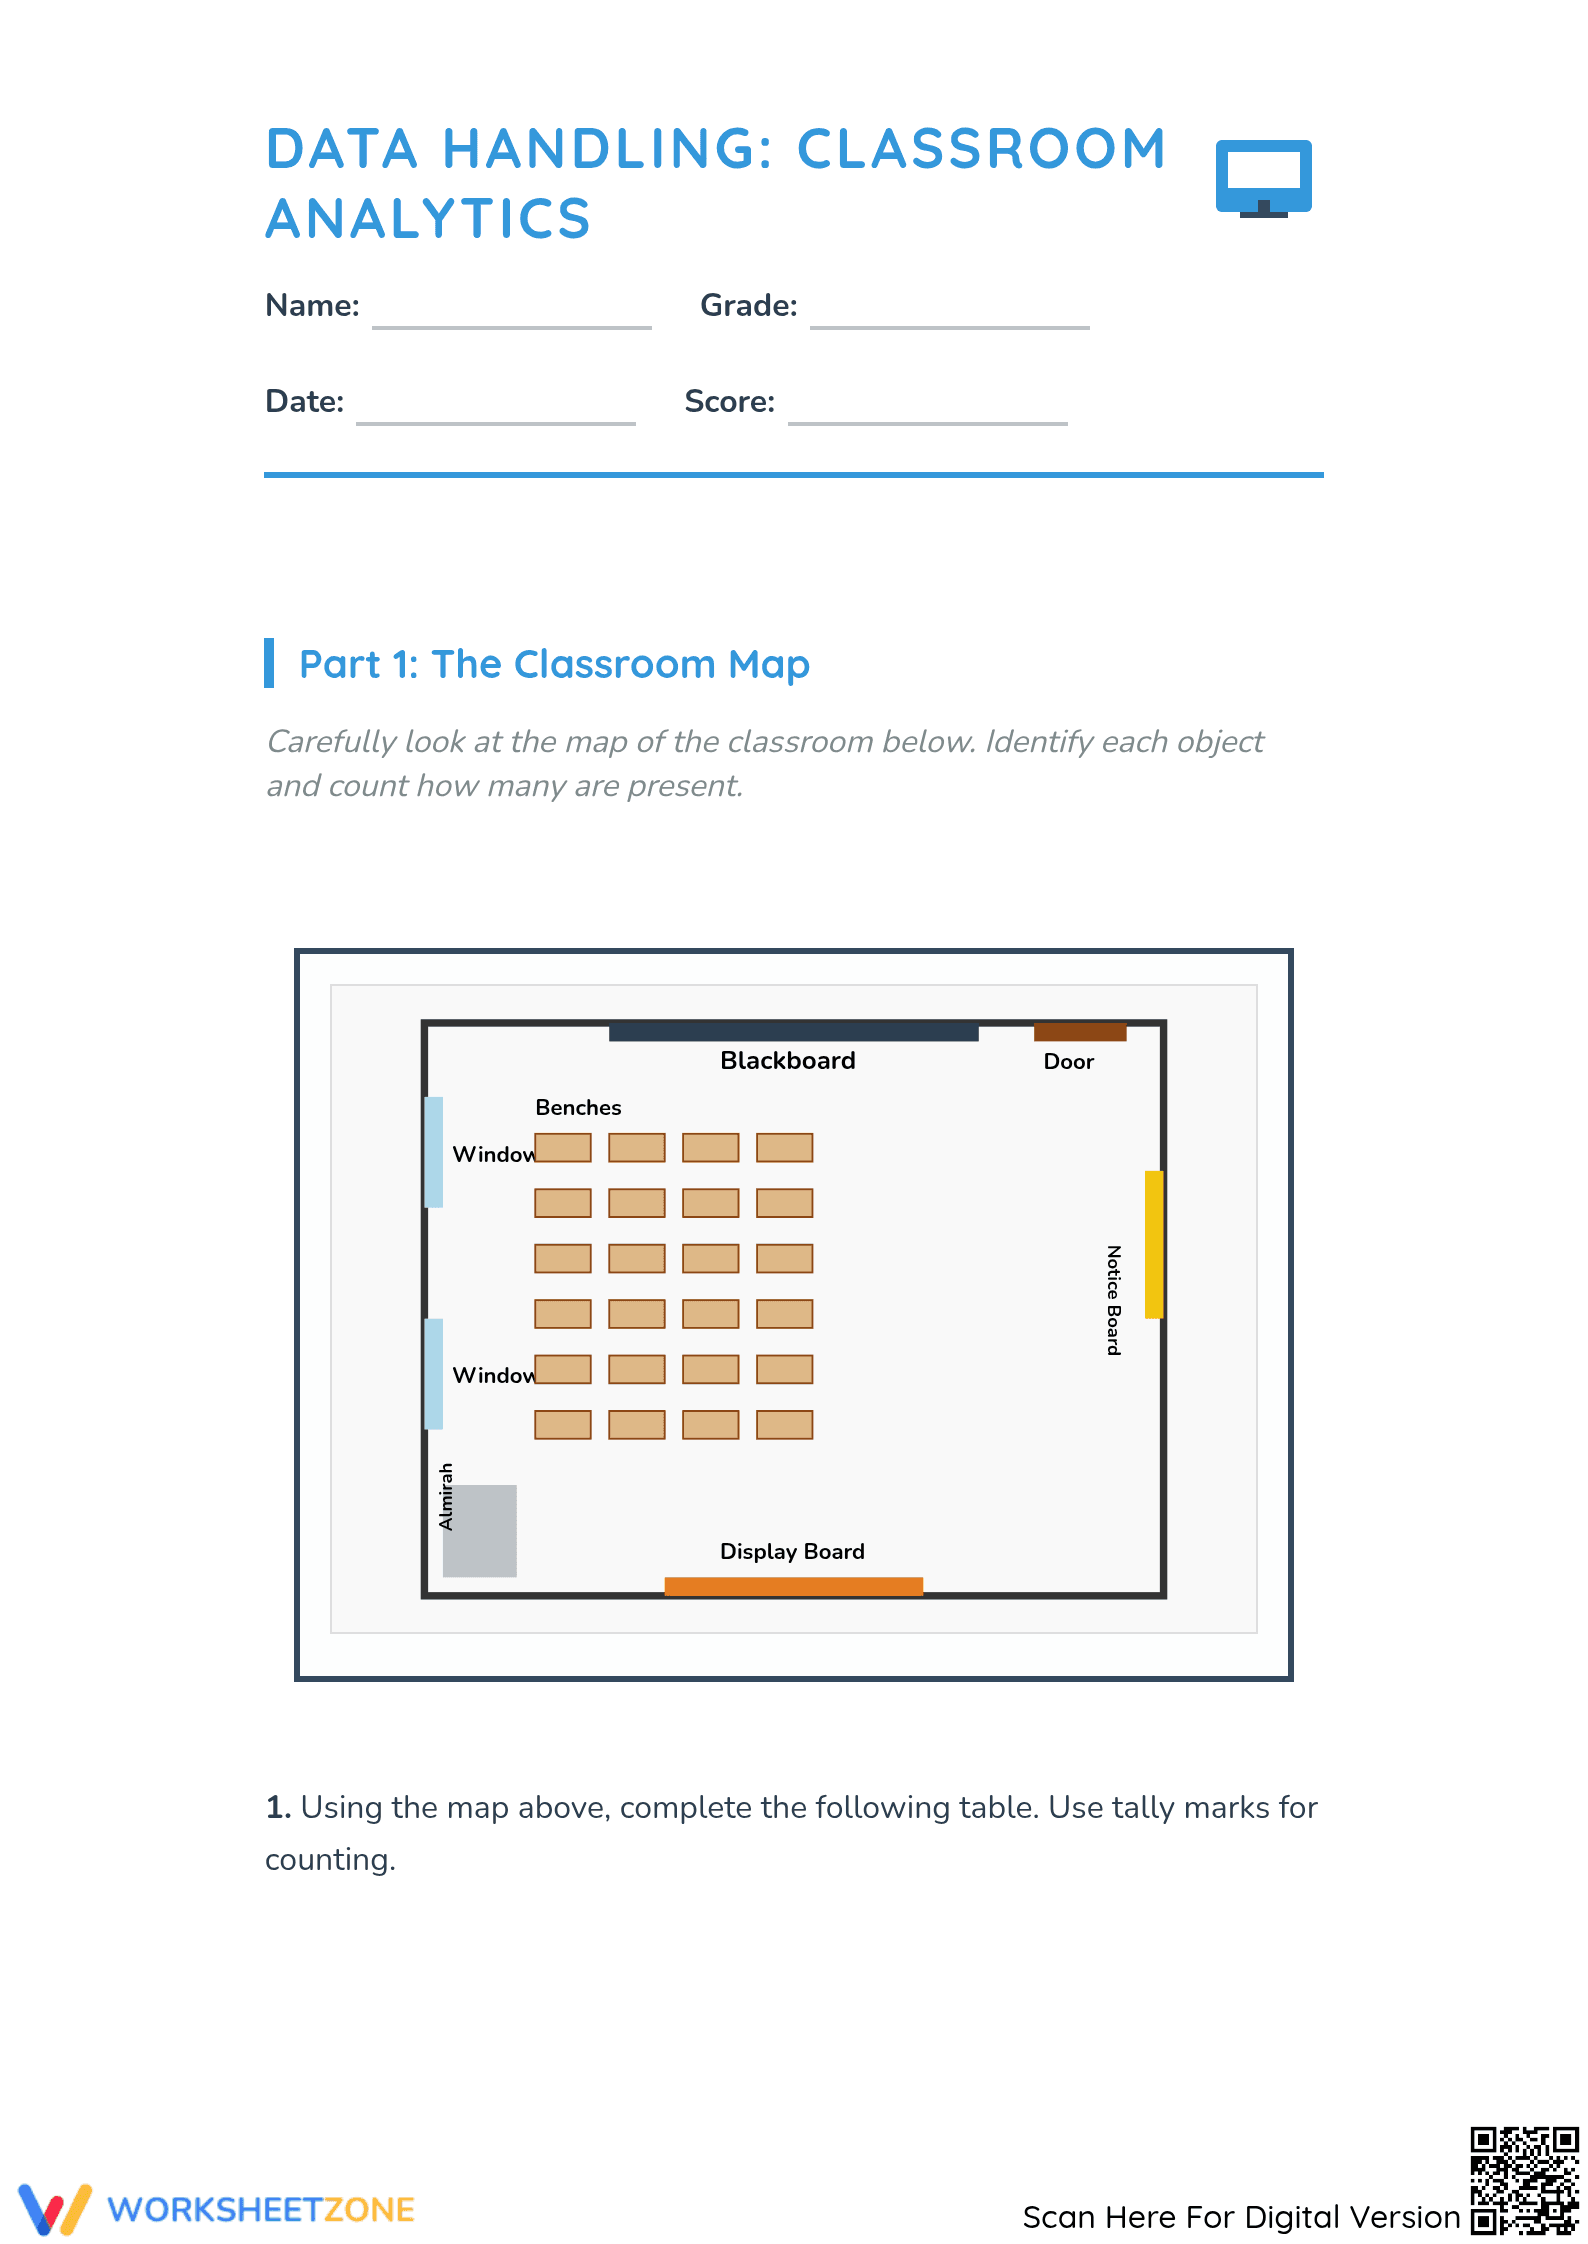
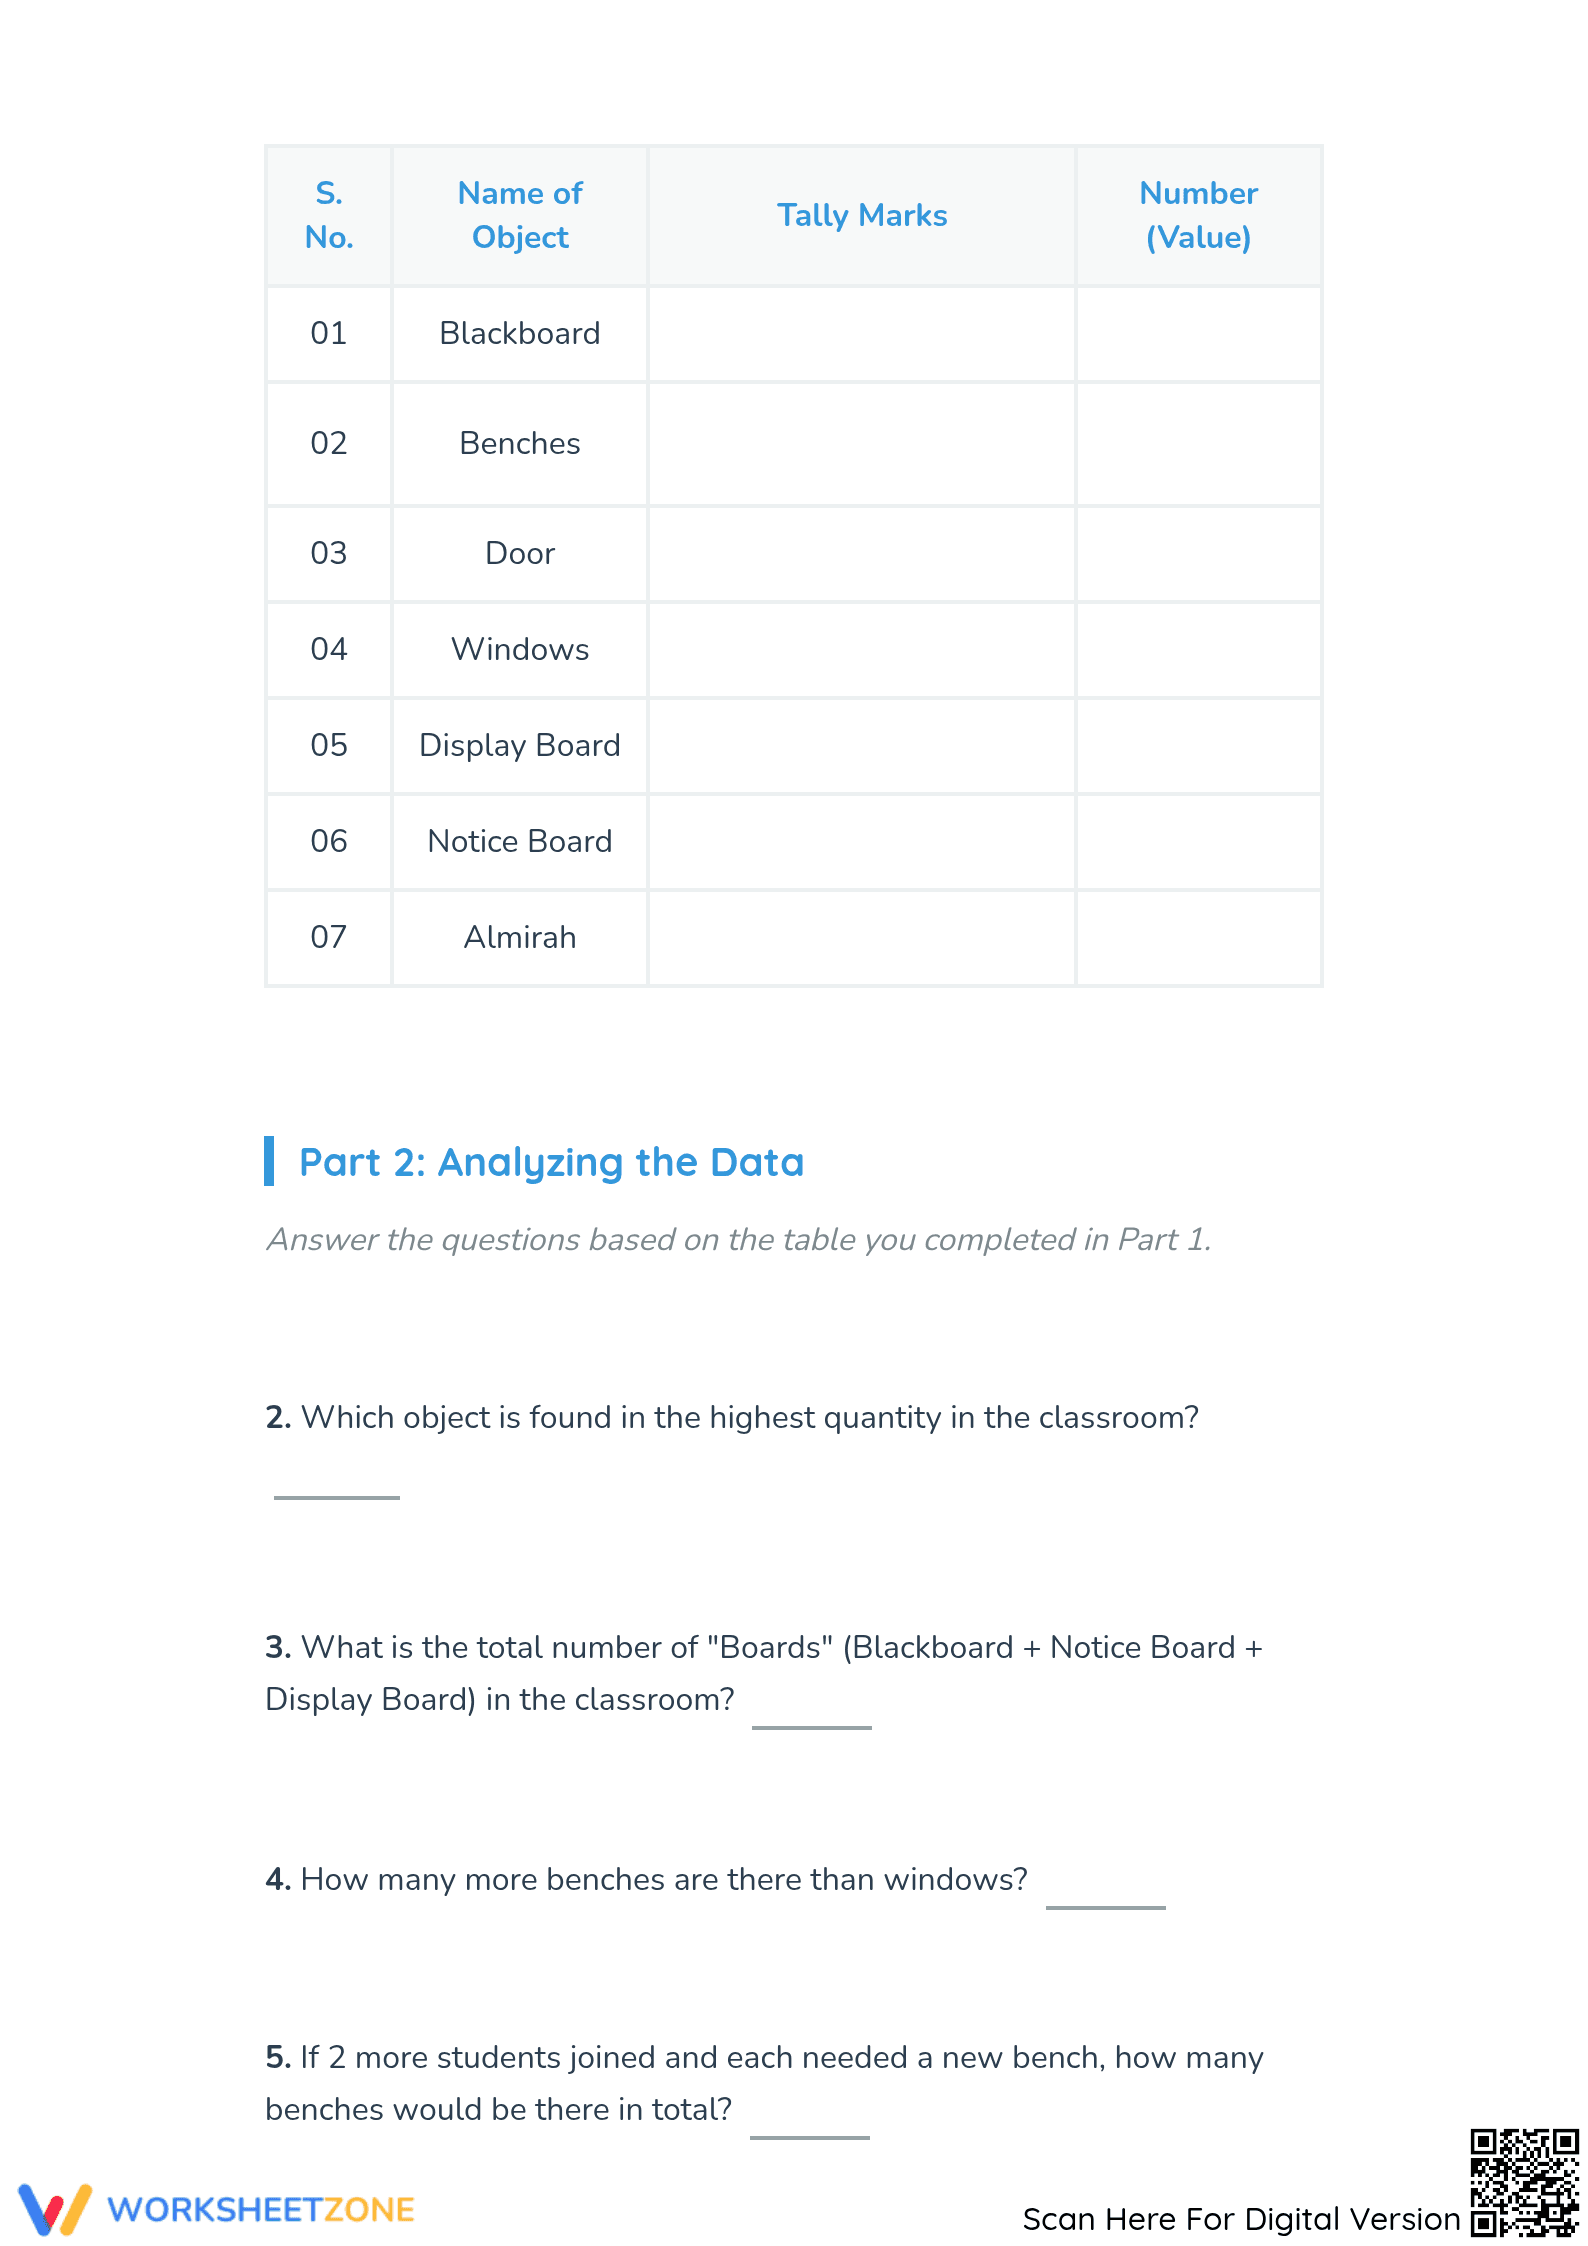
This comprehensive data handling worksheet provides Grade 4 students with focused practice in collecting, representing, and interpreting data. Through a series of engaging tasks involving familiar classroom objects, students will solidify their understanding of tally marks, frequency tables, and bar graphs, turning raw counts into clear visual representations and actionable insights.
At a Glance
- Grade: 4 · Subject: Math
- Standard:
CCSS.MATH.CONTENT.3.MD.B.3— Draw a scaled bar graph to represent a data set with several categories.- Skill Focus: Data Handling and Graphing
- Format: 4 pages · 11 problems · Answer key included · PDF
- Best For: Independent practice, math centers, or substitute plans
- Time: 25–40 minutes
What's Inside
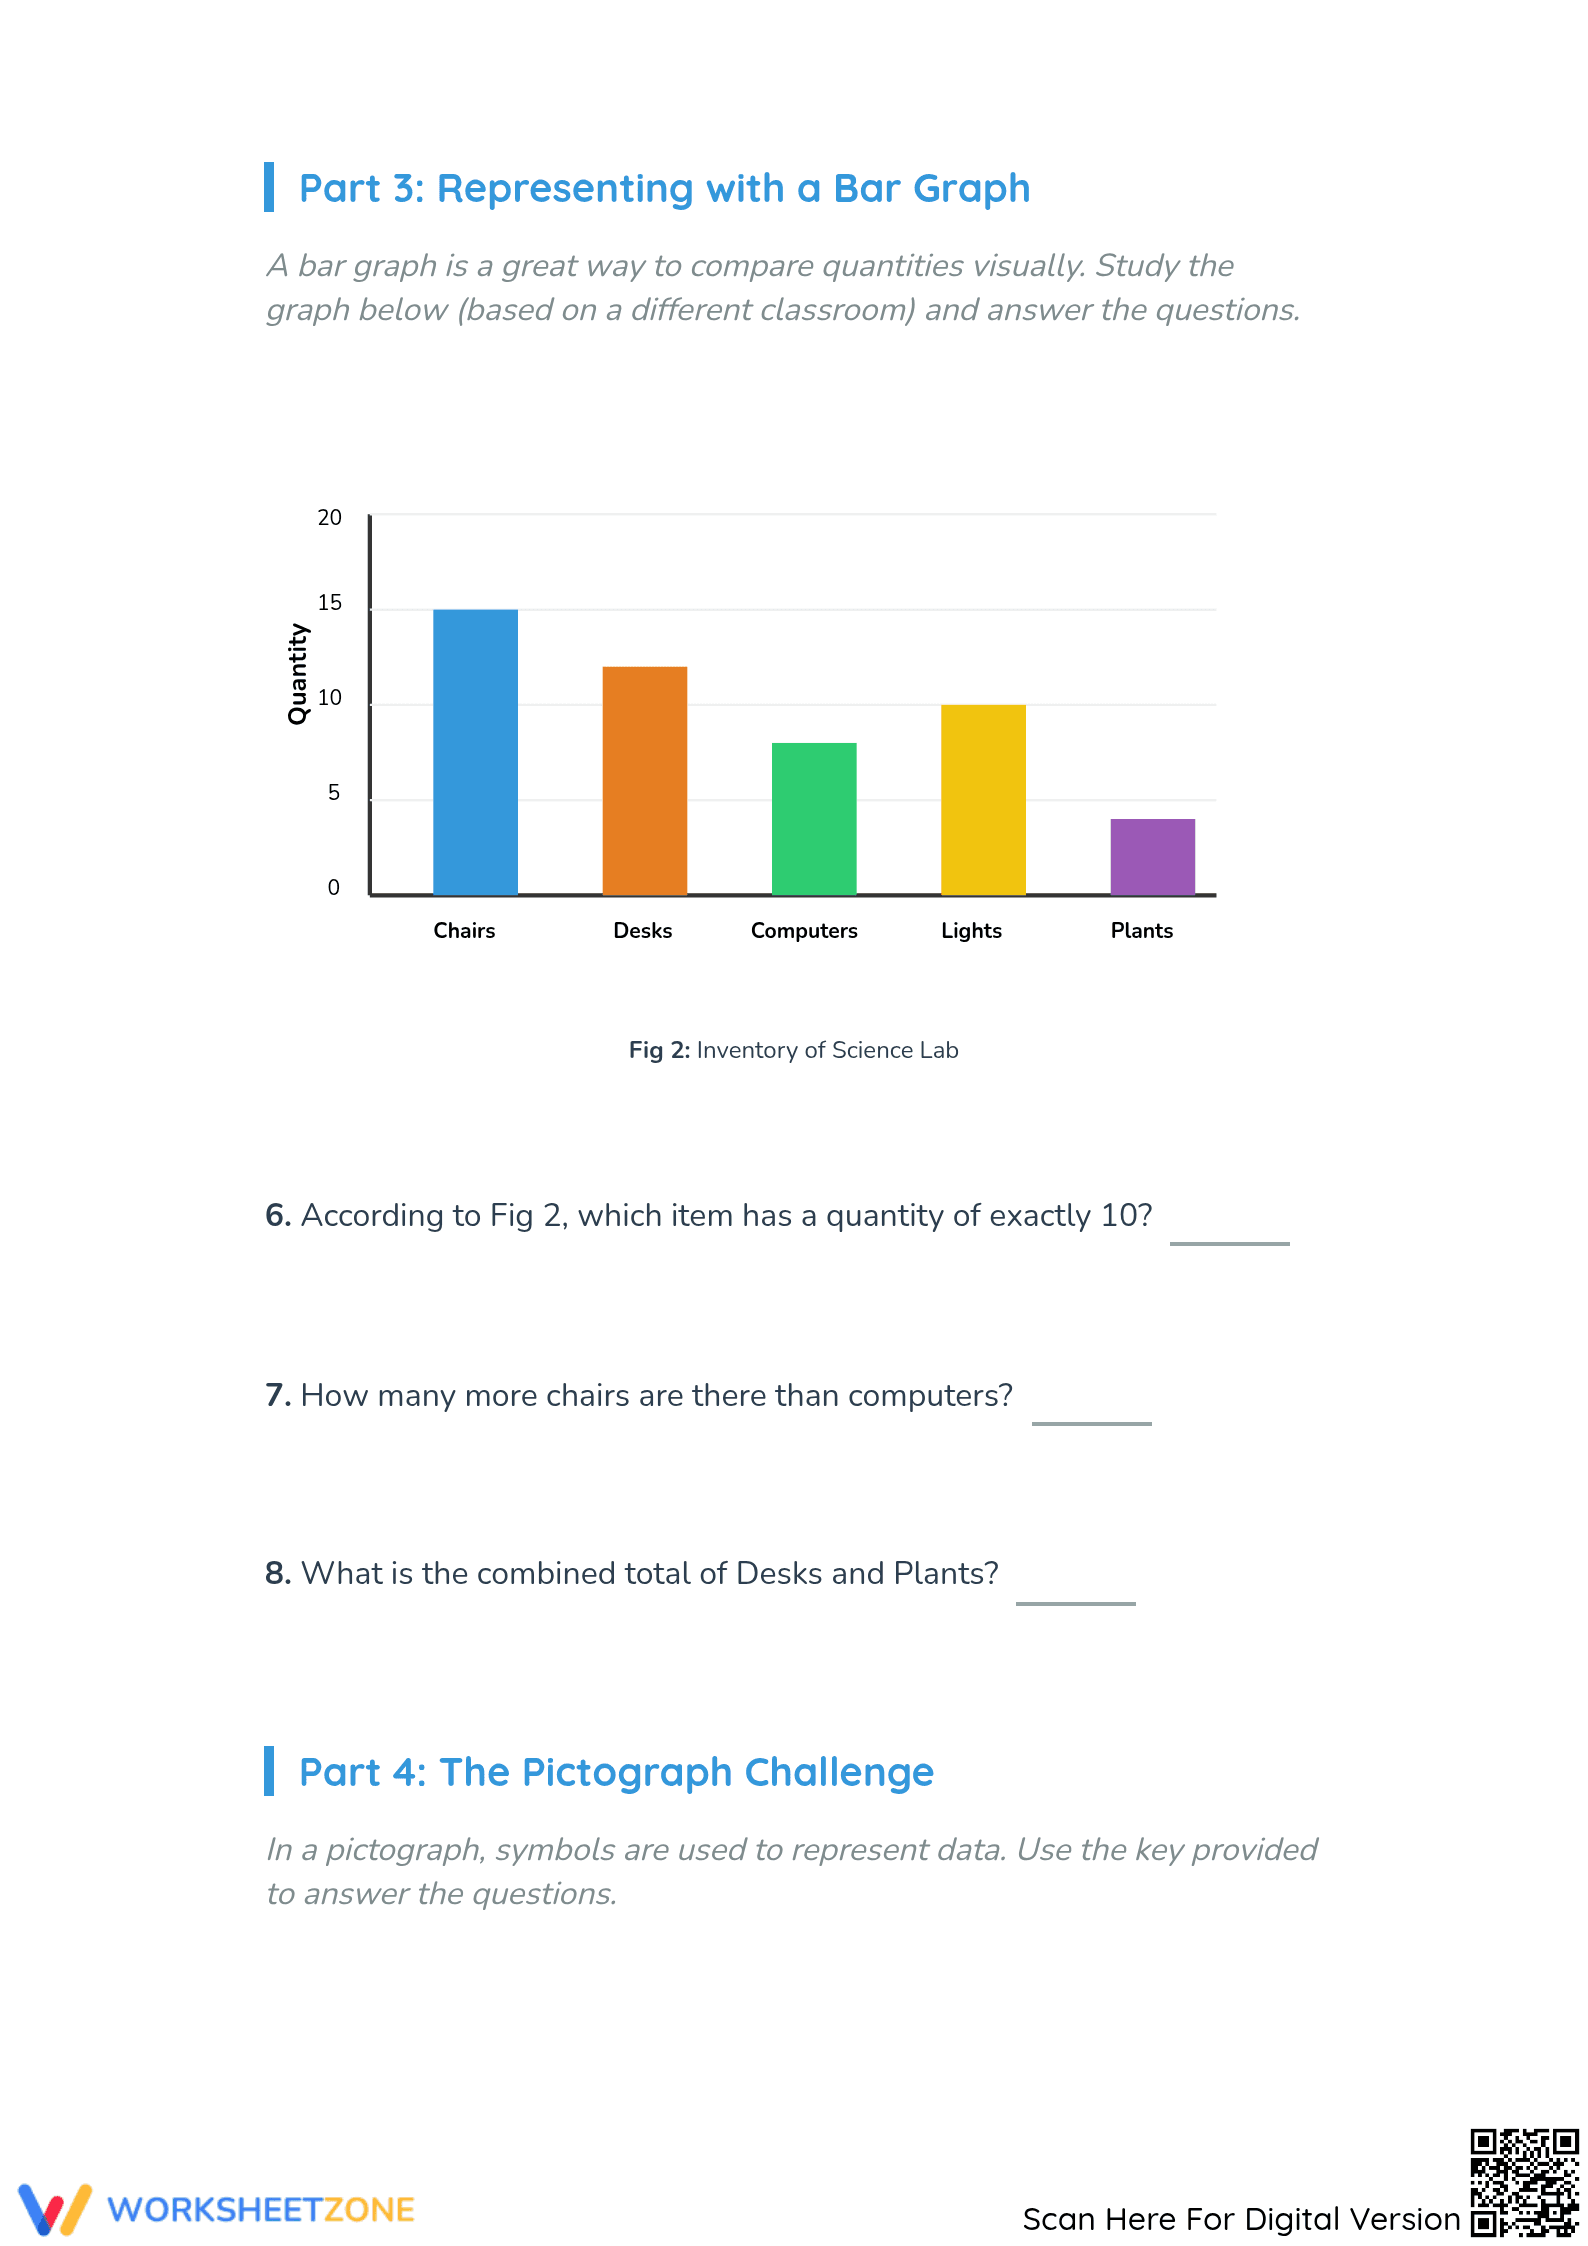
This four-page resource guides students through a complete data exercise. They will count classroom objects, use the data to create a scaled bar graph, and answer interpretive questions based on their graph. A full four-page answer key provides correct counts and a model of the completed graph for easy review or self-checking.
A Simple, Zero-Prep Workflow
This worksheet is designed for efficiency, requiring minimal teacher preparation. The workflow is simple:
- Print (1 min): The entire PDF packet is ready to go.
- Distribute (2 min): Students can begin immediately with clear, self-guided instructions.
- Review (5-10 min): Use the included answer key for fast and accurate checking.
With a total prep time under 3 minutes, this resource is an ideal tool for focused practice, math rotations, or for a substitute teacher.
Standards-Based Practice
This worksheet directly aligns with foundational data skills from the Common Core State Standards. The primary standard is CCSS.MATH.CONTENT.3.MD.B.3, which focuses on drawing and interpreting scaled bar graphs. While tagged for Grade 4 as a review, the core skill maps to this third-grade expectation, making it an excellent tool for reinforcing key concepts. The standard code can be copied directly into lesson plans or curriculum maps.
Classroom Application
Use this worksheet after an initial lesson on graphing for independent practice. It serves as an excellent piece of formative assessment; a quick observation can reveal which students are confident with the concepts versus those who need support. The activity is designed to fit within a single 25- to 40-minute math block, making it a substantial task for one class period or a math center rotation.
Built for Your Students
This resource is ideal for 4th-grade students needing to reinforce core data concepts or for 3rd graders working on-level. The familiar topic makes the task accessible. For a complete lesson, pair this worksheet with a short instructional video on creating scales for graphs or an anchor chart showing the components of a bar graph.
This resource provides targeted practice on CCSS.MATH.CONTENT.3.MD.B.3, a critical early data analysis skill. By requiring students to not only collect and represent data but also interpret it, the worksheet addresses the full cycle of statistical thinking at this level. Research from the RAND AIRS 2024 report highlights the importance of procedural fluency in graphing as a gateway to higher-order statistical reasoning in later grades. The worksheet's structure—moving from concrete counting to abstract representation and finally to interpretation—supports this development. With 11 distinct tasks across four pages, it offers a contained yet thorough exercise in translating raw numbers into a bar graph and using that visualization to answer comparative questions. This process is a foundational skill for developing evidence-based analysis abilities that are applicable across all academic subjects later in a student's education.