Before students can graph sine and cosine functions with any accuracy, they need a working command of the unit circle and radian measure. In most Algebra 2 and Precalculus sequences, this unit sits right after students have explored right-triangle trigonometry, so the shift to circular functions and continuous graphs can feel abrupt. Worksheets that open with unit circle review, converting between degrees and radians, and plotting a handful of key points from y equals sin x give students a bridge into the transformation work that follows.
Teachers planning a trig functions unit often find it useful to spend a full class period just on parent graphs before introducing any transformations at all. Students who can sketch y equals sin x and y equals cos x from memory, including where each function crosses the midline and reaches its maximum and minimum, are far better equipped to layer transformations on top later.
Reading the General Form: Amplitude, Period, Phase Shift, and Midline
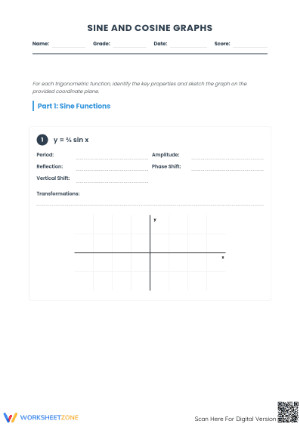
The general form y equals A sin(Bx + C) + D, and its cosine equivalent, packs four pieces of information into one equation. Amplitude is the absolute value of A, period is 2 pi divided by the absolute value of B, phase shift is negative C over B, and midline is the horizontal line y equals D. Many worksheets ask students to extract these four values from an equation before ever touching graph paper, which builds the habit of translating symbolic information into a graphing plan.
This step-by-step extraction directly supports CCSS.Math.Content.HSF-TF.B.5, which asks students to choose trigonometric functions to model periodic phenomena with specified amplitude, frequency, and midline. Worksheets that pair equation-to-graph practice with graph-to-equation practice reinforce both directions of this standard.
A Step-by-Step Graphing Routine for the Classroom
A consistent routine helps students avoid skipping steps under time pressure. One reliable sequence for the classroom:
- Identify amplitude, period, phase shift, and midline from the equation.
- Sketch the midline first, then mark the maximum and minimum values based on amplitude.
- Divide one period into four equal intervals to locate key points.
- Apply the phase shift by moving the starting point left or right.
- Plot the shifted key points and connect them with a smooth curve.
Worksheets structured around this five-step routine, with space for students to write out each value before graphing, tend to reduce careless errors more than worksheets that jump straight to blank coordinate grids.
Common Errors and Misconceptions Students Bring to This Unit
Several errors show up consistently across classrooms working through this unit. Students frequently confuse the direction of the phase shift, moving the graph right when C is positive instead of left, because they forget the negative sign in the phase shift formula. Others mix up sine and cosine starting points, assuming both begin at the midline when cosine actually starts at its maximum or minimum. Miscalculating the period is another frequent issue, especially when B is a fraction or when students divide instead of multiply by 2 pi.
A useful diagnostic move is to have students graph y equals cos(x) and y equals sin(x) side by side before any transformations appear on a worksheet, since roughly half of the errors that show up later in a transformed graphing task trace back to a shaky mental image of these two parent graphs rather than a misunderstanding of the transformation rules themselves.
Modeling Real Periodic Phenomena with Sine and Cosine Graphs
Once students are comfortable with the mechanics of graphing, worksheets that connect sine and cosine to real periodic phenomena, such as tides, average monthly temperatures, or sound waves, give the unit more staying power. A worksheet task might describe a tide pattern with a given amplitude and period and ask students to write an equation, then sketch the graph and identify the midline in context, such as average sea level.
According to the Common Core State Standards Initiative, the high school Functions strand under Trigonometric Functions calls for students to choose trigonometric functions to model periodic phenomena using specified amplitude, frequency, and midline, a requirement captured directly in CCSS.Math.Content.HSF-TF.B.5 and reinforced through the unit circle work in CCSS.Math.Content.HSF-TF.A.2.
Teacher Tips for Using These Worksheets
A few practical habits make graphing worksheets more effective in daily instruction. Use a short warm-up worksheet at the start of class that asks students to state amplitude, period, phase shift, and midline for one equation, which takes only a few minutes but keeps the vocabulary active throughout the unit. Pair worksheet practice with a quick partner check where students compare key points before drawing the curve, catching arithmetic errors before they become graphing errors.
Worksheets also work well as formative assessment checkpoints. A short, four-question graphing worksheet given midway through the unit can reveal whether students are ready to move into modeling tasks or need another day on the mechanics of transformations. Keeping a few worksheet versions on hand, ranging from guided to independent, makes it easy to place students appropriately without redesigning a lesson.
Frequently Asked Questions
1. What grade level typically covers graphing sine and cosine functions?
Graphing sine and cosine functions is typically introduced in Algebra 2 and reinforced in Precalculus, generally in grades 10 through 12, depending on a school's math sequence.
2. How do amplitude, period, and phase shift affect a sine or cosine graph?
Amplitude controls the height of the graph above and below the midline, period controls how long it takes to complete one full cycle, and phase shift moves the graph left or right along the x-axis.
3. What CCSS standards align with graphing trigonometric functions?
CCSS.Math.Content.HSF-TF.B.5 addresses modeling periodic phenomena with specified amplitude, frequency, and midline, while CCSS.Math.Content.HSF-TF.A.2 and CCSS.Math.Content.HSF-TF.A.4 cover extending trigonometric functions using the unit circle and radian measure.
4. How can teachers use these worksheets for review or formative assessment?
Short worksheets focused on extracting amplitude, period, phase shift, and midline from an equation work well as warm-ups, while longer graphing tasks make effective checkpoints midway through a trig functions unit.
5. What are common student misconceptions when graphing sine and cosine functions?
Students often reverse the direction of the phase shift, confuse the starting points of sine and cosine graphs, and miscalculate the period when B is a fraction rather than a whole number.