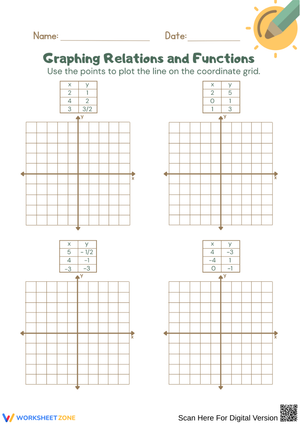
If your students just finished linear equations, graphing absolute value functions is the natural next step. The V-shaped graph is really two linear pieces with opposite slopes joined at a vertex, so students are not learning an entirely new skill, they are extending one they already have. Graphing absolute value functions worksheets that lean into this connection help Algebra 1 and Algebra 2 teachers bridge from slope-intercept thinking into piecewise and transformation concepts without losing momentum.
Absolute value functions do not have their own dedicated standard in the Common Core. Instead, CCSS.HSA.REI.D.11 folds them into the broader expectation that students graphically solve f(x) = g(x) for linear, polynomial, rational, absolute value, exponential, and logarithmic functions. That framing matters for lesson planning: worksheets should treat absolute value graphing as one entry point into a bigger function-comparison skill, not an isolated topic to check off a list.
Table of Values Versus Vertex-and-Symmetry Graphing
Most classrooms teach two approaches to graphing absolute value functions, and a strong worksheet set should give students practice with both before letting them choose.
- Table of values: students plug in x values on either side of the expected vertex, plot points, and connect them. This method is slower but builds number sense and confirms the V-shape from first principles.
- Vertex-and-symmetry graphing: students identify the vertex directly from vertex form, then use slope and symmetry to sketch both branches quickly. This is the more efficient method and the one students should default to once they are comfortable with transformations.
Sequencing worksheets from table-of-values to vertex-and-symmetry gives struggling students a fallback method while still pushing the class toward fluency.
Teaching Vertex Form as a Transformation Toolkit
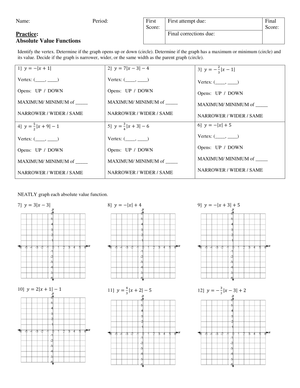
The equation y = a|x - h| + k is the backbone of any solid absolute value unit. Once students can read this form, graphing absolute value functions becomes a matter of translation rather than memorization.
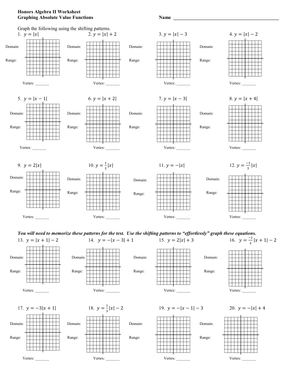
- h controls the horizontal shift, and students often need repeated practice remembering that the shift is opposite the sign inside the absolute value bars.
- k controls the vertical shift, moving the vertex up or down.
- a controls steepness and reflection: a value between negative one and one and positive one widens the V, a value greater than one in absolute terms narrows it, and a negative a flips the graph so it opens downward.
Worksheets that isolate one parameter at a time, then combine all three, mirror how transformations are usually taught for other function families, which keeps the unit consistent across the course.
Common Student Misconceptions to Target
A few errors show up again and again when students first practice graphing absolute value functions, and worksheets can be designed specifically to surface and correct them.
- Graphing only one branch of the V, treating the function like a single line instead of two joined rays.
- Applying the horizontal shift in the wrong direction because they miss the sign flip inside the bars.
- Missing a negative a value entirely and graphing the reflection as if a were positive.
- Assuming the vertex is always the minimum, which breaks down as soon as a is negative and the vertex becomes a maximum.
Building a worksheet or two around these specific traps, rather than only generic practice problems, gives you a diagnostic tool as much as a practice tool.
Classroom Implementation
Graphing absolute value functions worksheets work well across several classroom moments, not just as standalone homework.
- Warm-up or exit ticket: a single vertex-form equation with a quick sketch checks whether students retained the shift-and-reflection rules from the previous lesson.
- Small-group intervention: pull students who are still relying on tables of values and pair them with a worksheet that scaffolds directly into vertex-and-symmetry graphing, one parameter at a time.
- Enrichment: ask advanced students to work backward, given a graph, write the vertex form equation, which reinforces the same skill from the opposite direction.
- Unit review: a mixed worksheet combining table-of-values and vertex-form problems previews how absolute value functions will resurface when the class moves into piecewise functions later in Algebra 2.
Because the skill sits at the intersection of linear equations and transformation concepts, these worksheets are also useful diagnostic material at the start of an Algebra 2 course to confirm students retained the graphing habits from Algebra 1.
Connecting to Broader Function Transformation Standards
Once students are fluent with y = a|x - h| + k, the same transformation logic transfers directly to quadratics, square root functions, and other parent functions later in the course. Framing graphing absolute value functions worksheets explicitly as transformation practice, rather than an isolated V-shape topic, sets up an easier transition when the class reaches those units. Teachers who treat this as a transferable skill tend to spend less reteaching time later in the year.
Frequently Asked Questions
1. What grade level typically covers graphing absolute value functions?
This topic is most common in Algebra 1 and Algebra 2 courses, generally serving grades 8 through 10, depending on when a school sequences its algebra pathway.
2. What is the difference between table-of-values and vertex-based graphing methods?
Table-of-values graphing has students plot several points to build the V-shape from scratch, which is slower but reinforces the underlying structure. Vertex-and-symmetry graphing has students identify the vertex and slope directly from vertex form, which is faster once transformations are understood.
3. How does vertex form y = a|x - h| + k help students graph faster?
Vertex form lets students read the horizontal shift, vertical shift, and steepness or reflection directly from the equation, skipping the need to plot multiple points before sketching an accurate graph.
4. What are common student errors when graphing absolute value functions?
Frequent errors include graphing only one branch of the V, shifting horizontally in the wrong direction, missing a negative a value, and assuming the vertex is always a minimum point.
5. How can teachers use these worksheets for intervention versus enrichment?
For intervention, pair students with scaffolded worksheets that isolate one transformation parameter at a time. For enrichment, use worksheets that ask students to work backward from a graph to write the vertex form equation.