


0
Views
0
Downloads
0.0
0
Save
0 Likes
Exploring Two Way Frequency Tables with Poll Data
0 Views
0 Downloads
Paste this activity's link or code into your existing LMS (Google Classroom, Canvas, Teams, Schoology, Moodle, etc.).
Students can open and work on the activity right away, with no student login required.
You'll still be able to track student progress and results from your teacher account.
Information
Description
What It Is:
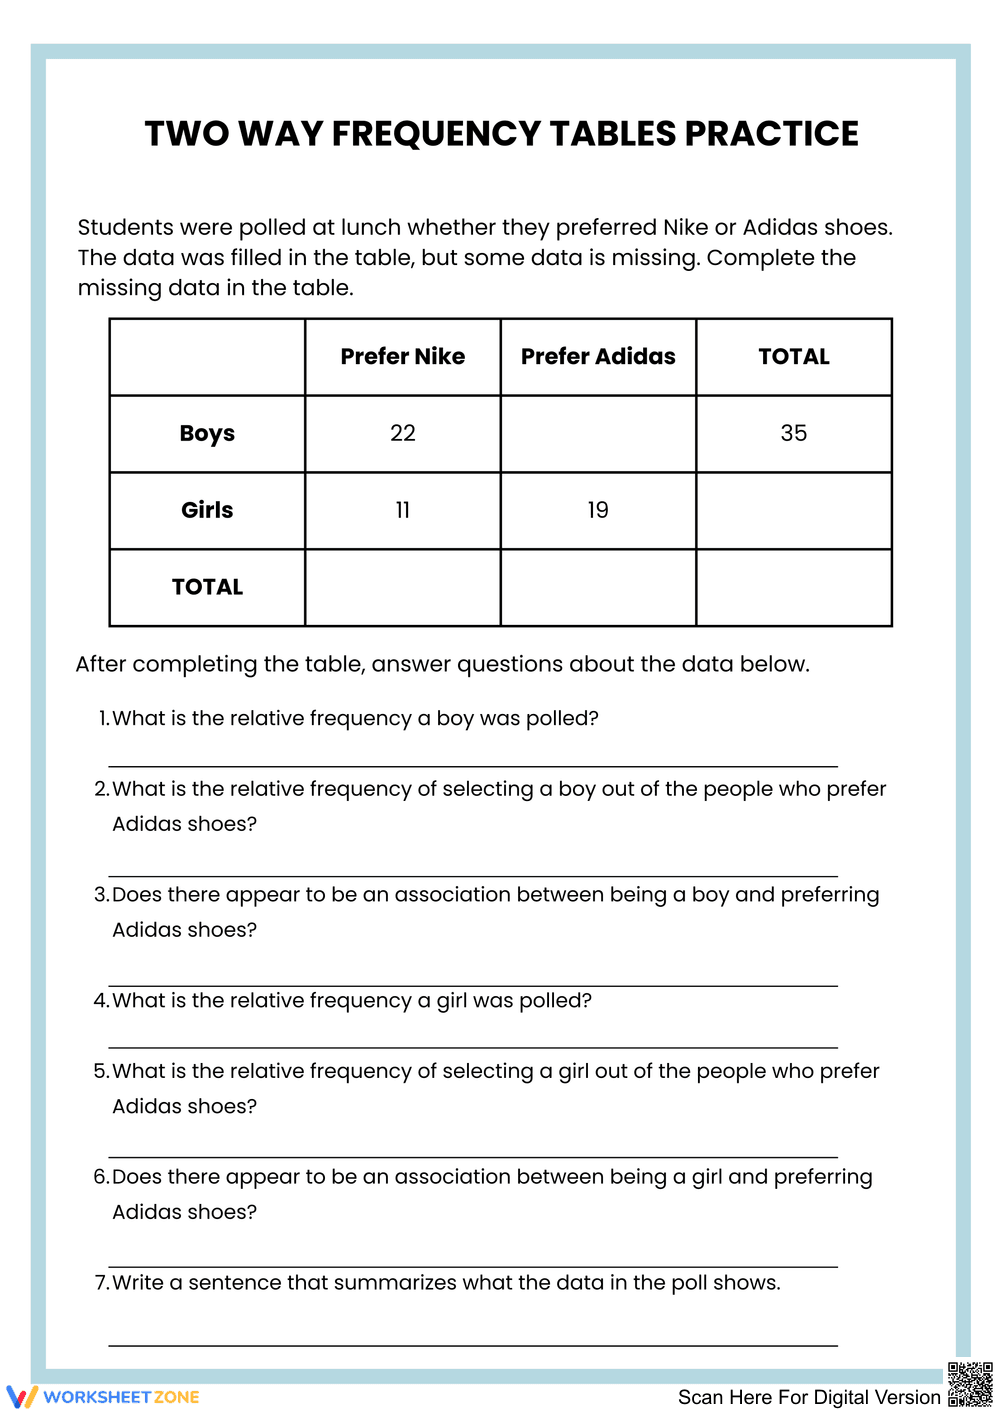
This worksheet includes a two-way frequency table that presents poll results on students' shoe brand preferences, featuring both boys and girls. Students will analyze and complete the missing data in the table, followed by answering related questions.
Why Use It:
This activity supports data interpretation skills and enhances understanding of frequency tables, helping students draw conclusions from the gathered data.
How to Use It:
• Complete the missing data in the frequency table.
• Answer questions related to the data.
• Discuss findings with classmates.
Grade Suitability:
Best for Grade 5 to Grade 8.
• Younger kids focus area: Understanding basic data representation.
• Older students focus area: Analyzing data relationships and frequencies.
Target Users:
This worksheet is designed for teachers, parents, and students.