


0
Views
0
Downloads
0.0
0
Save
0 Likes
Interpreting Two-Way Frequency Tables for Data Exploration
0 Views
0 Downloads
Paste this activity's link or code into your existing LMS (Google Classroom, Canvas, Teams, Schoology, Moodle, etc.).
Students can open and work on the activity right away, with no student login required.
You'll still be able to track student progress and results from your teacher account.
Information
Description
What It Is:
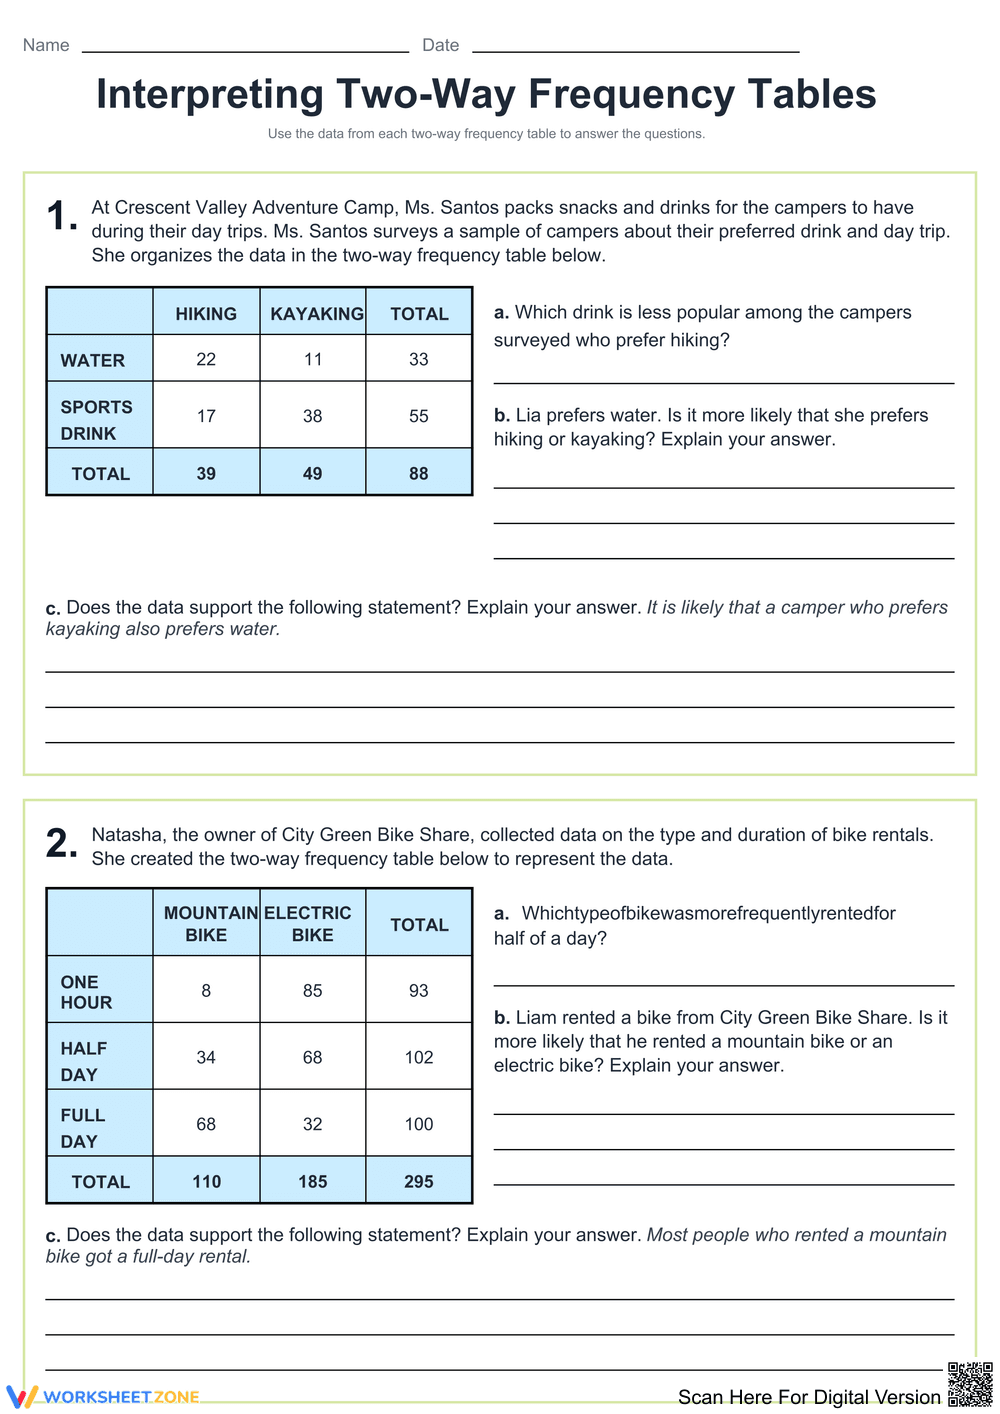
This worksheet features two two-way frequency tables that help students interpret data regarding campers' drink preferences and bike rental choices. The engaging visuals guide students through real-world scenarios.
Why Use It:
This activity reinforces analytical skills by encouraging learners to draw conclusions from data. It promotes critical thinking as students evaluate relationships between variables.
How to Use It:
• Begin by reviewing the scenarios presented in the tables.
• Encourage students to calculate totals and analyze the data.
• Facilitate discussions on interpretations and possible implications.
Grade Suitability:
Best for Grade 7 to Grade 9.
• Younger kids focus on basic interpretation skills.
• Older students delve into deeper analytical reasoning.
Target Users:
This worksheet is designed for teachers, parents, and students aiming to improve data literacy skills.