


0
Views
0
Downloads
0.0
0
Save
0 Likes
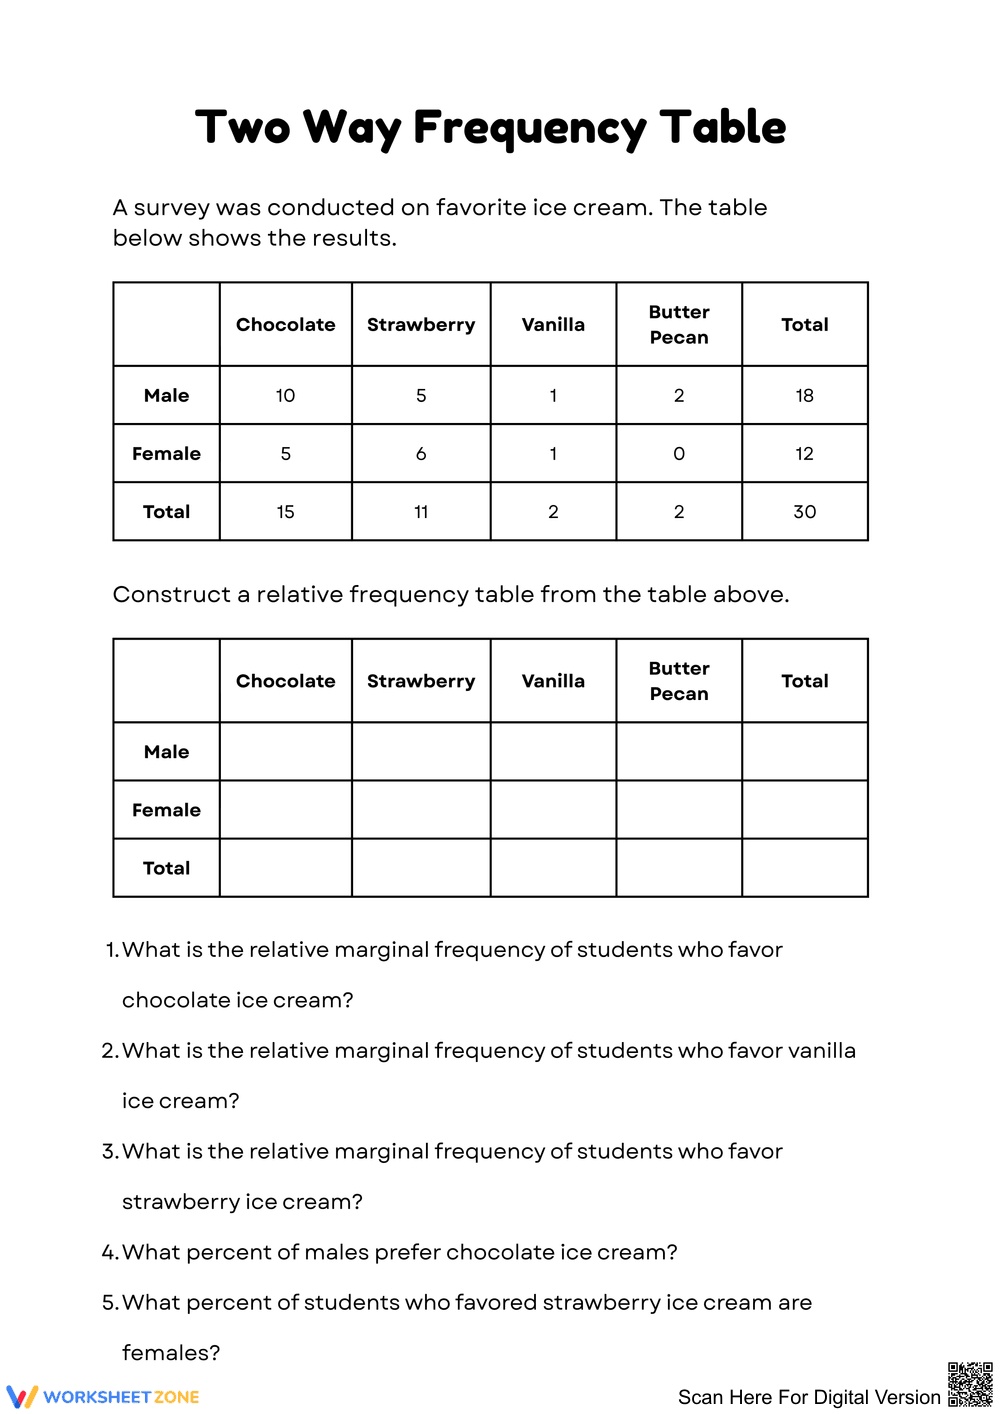
Analyzing Two-Way Frequency Tables with Ice Cream Survey
0 Views
0 Downloads
Paste this activity's link or code into your existing LMS (Google Classroom, Canvas, Teams, Schoology, Moodle, etc.).
Students can open and work on the activity right away, with no student login required.
You'll still be able to track student progress and results from your teacher account.
Information
Description
What It Is:
This worksheet helps students analyze data from a two-way frequency table based on a survey about favorite ice cream flavors. It includes visuals of the frequency table and tasks that require constructing a relative frequency table.
Why Use It:
This activity supports understanding of data representation and statistical analysis, encouraging critical thinking through practical application in a fun context.
How to Use It:
• Present the two-way frequency table to the students.
• Guide students in creating a relative frequency table based on the provided data.
• Discuss the questions at the end to reinforce the analysis of frequencies and proportions.
Grade Suitability:
Best for Grade 6 - Grade 8.
• Younger kids focus area: Basic frequency understanding.
• Older students focus area: Statistical analysis and proportions.
Target Users:
This worksheet is ideal for teachers and students looking to enhance their data analysis skills.