These 8th grade functions worksheets printable give teachers a set of resources organized by representation type — tables, mapping diagrams, graphs, and equations — so practice follows the conceptual sequence of the unit rather than jumping between formats without a clear through-line. Each worksheet targets a specific aspect of function understanding, from the foundational definition through comparison tasks that ask students to read two functions presented in different forms and explain what differs between them.
What Each Worksheet Covers
The skills below span the full arc of a typical functions unit. Some worksheets narrow in on a single task type; others spiral two or three ideas together for mid-unit review or cumulative practice before an assessment.
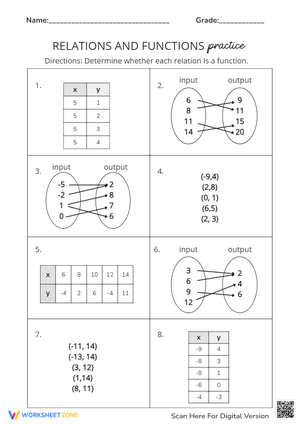
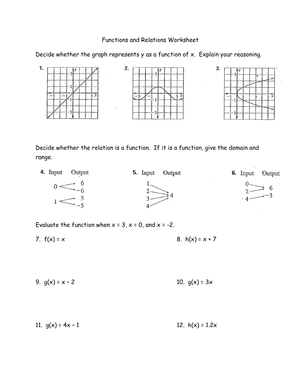
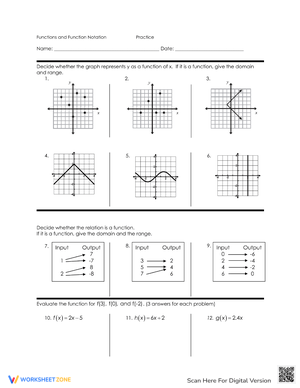
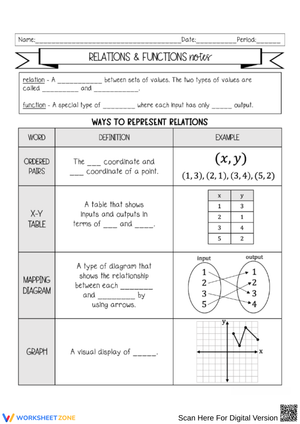
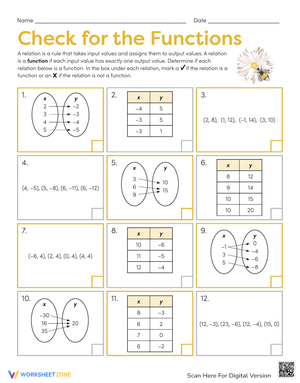
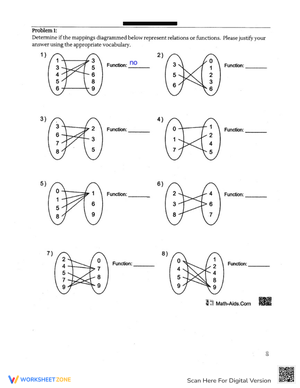
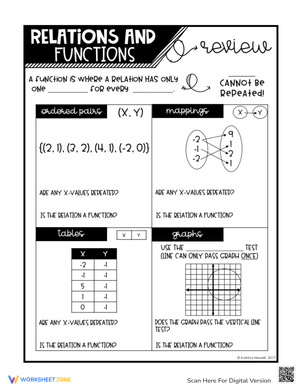
- Identifying functions: Students examine tables, mapping diagrams, sets of ordered pairs, and graphs to determine whether each relation qualifies as a function — one output for each input, no exceptions.
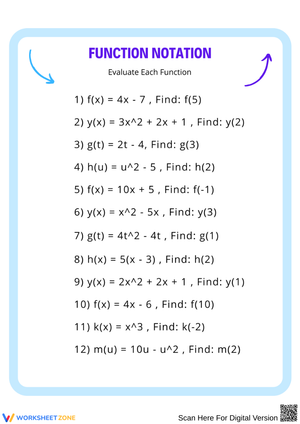
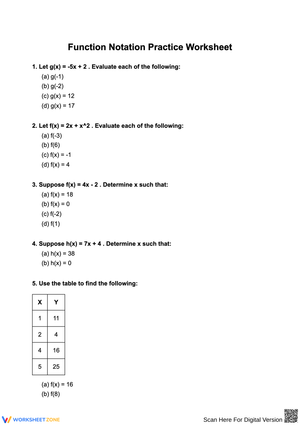
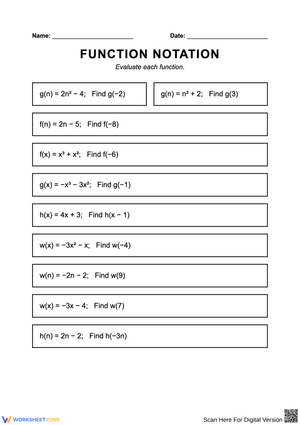
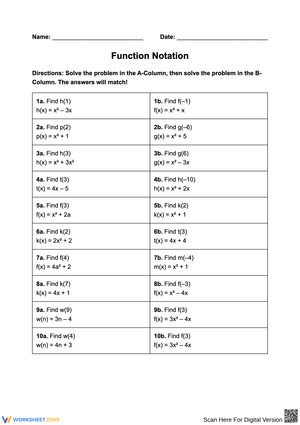
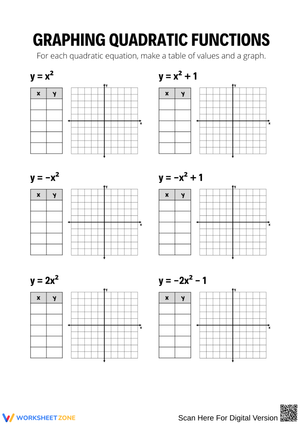
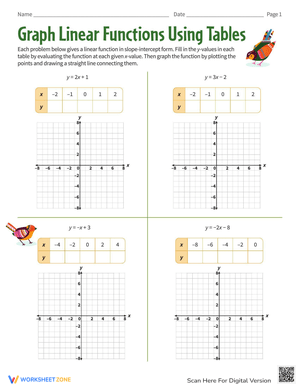
- Evaluating rules: Given an equation or verbal rule, students find output values for specified inputs and record results in tables or as ordered pairs.
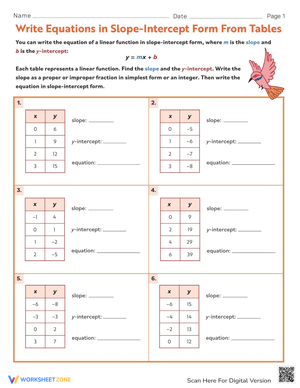
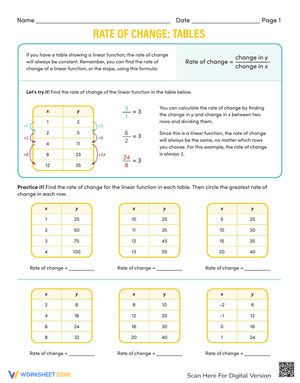
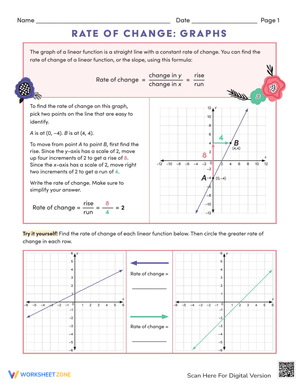
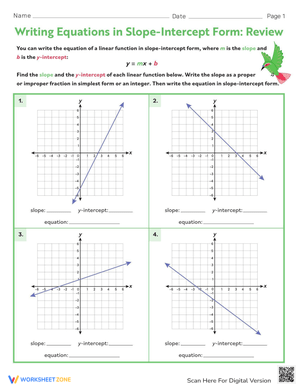
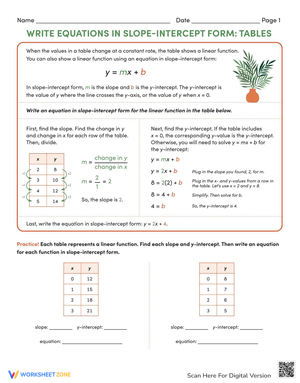
- Writing equations from tables: Students analyze completed input-output tables and write the equation that matches the pattern, identifying both rate of change and starting value.
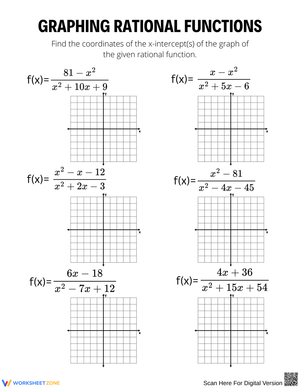
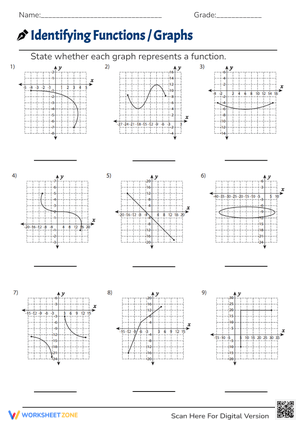
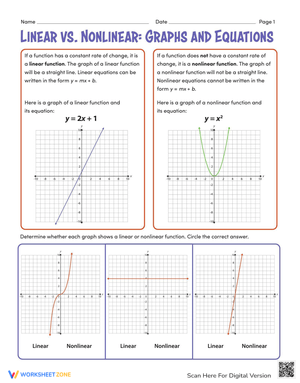
- Applying the vertical line test: Students determine whether a graph represents a function and connect that conclusion to the definition rather than treating the test as an isolated visual trick.
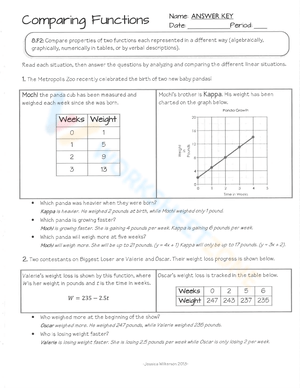
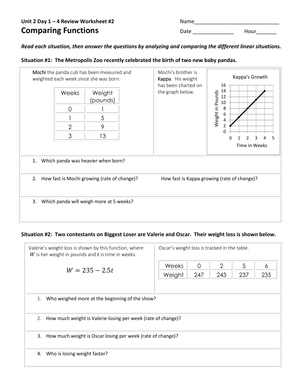
- Comparing functions across representations: Students examine two functions side by side — one as a graph, the other as an equation or table — and answer questions about rate of change, initial value, and which produces the greater output at a specific input value.
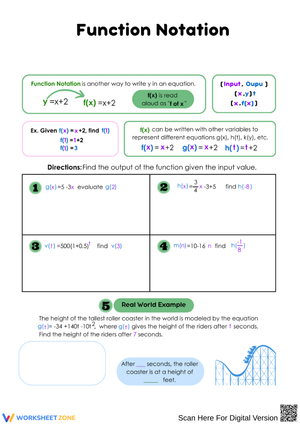
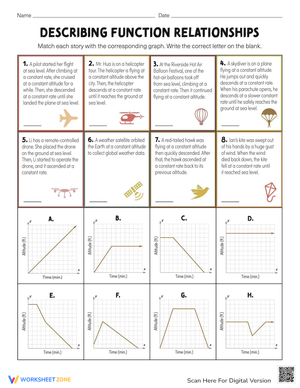
- Interpreting function values in context: Students explain what inputs and outputs mean in real situations involving cost, distance, or time.
Frequent Student Errors Worth Watching For
The most persistent error in function identification is confusing "one output per input" with "one input per output." Students encounter a function like f(x) = x² — where f(2) = 4 and f(-2) = 4 — and mark it as not a function because two different inputs produce the same output value. The definition doesn't prohibit that; it only prohibits a single input mapping to two different outputs. This error appears in student work regularly and needs direct correction before any graph-based tasks are introduced.
A second pattern surfaces in equation-writing tasks. Students correctly identify that output values increase by 5 for each unit increase in input, then write y = 5x. The rate of change is right, but the y-intercept is missing entirely. These students aren't misunderstanding the concept — they're stopping one step early. Asking students to verify their equation against at least two values from the table catches this before it becomes habitual.
Graph tasks tend to produce the highest error rate in the set. Students apply the vertical line test as a memorized visual step rather than as a consequence of the definition. They'll draw a vertical line somewhere on the graph, note it crosses the curve once at that location, and conclude the relation is a function — without checking systematically across all x-values. This approach fails specifically on graphs where the problematic input sits near the edge of the plotted area or at a less obvious point on the x-axis.
Fitting These Worksheets Into Your Unit Plan
Function understanding builds in stages, and which worksheet to reach for depends on where the class sits in that progression. At the start of the unit, table-based identification worksheets work well because students can trace each input to its output without the added visual complexity of a coordinate plane. Mapping diagrams are even more direct — every arrow from input to output is explicit, and students can check the definition without first interpreting a graph. These belong in the first two or three lessons, used as independent practice in the last 10 minutes of a period after guided instruction wraps up.
Sorting 8th grade functions worksheets printable by representation type before the unit begins — one group for identification, one for evaluation, one for comparison tasks — saves real time mid-unit when a lesson runs short or a small group needs targeted review and there's no prep window to spare.
Once students can identify and evaluate functions reliably, graph-based worksheets become productive. The shift from table to graph is where many students stall, so a worksheet that displays the same function as both a table and a graph — and asks students to verify both against the definition — tends to bridge that gap faster than graph-only practice. Comparison worksheets, which place two differently represented functions side by side, belong near the end of the unit; using them earlier raises cognitive load before students have worked with each representation on its own.
Near the end of the unit, mixed-review worksheets that combine identification, evaluation, and a short context-interpretation item are the most useful pre-quiz check teachers have. A 15-minute mixed worksheet reveals which concept still needs reteaching — the definition itself, reading a graph, or connecting an equation to a real situation. These same worksheets hold up well on Monday mornings after a weekend, when the previous week's instruction has had time to blur.
Standard Alignment
The worksheets here address the full CCSS 8.F domain. The first cluster — 8.F.A — covers defining functions (8.F.A.1), comparing functions shown in different representations (8.F.A.2), and interpreting y = mx + b as a linear function rule (8.F.A.3). Identification and evaluation worksheets align to these standards and fit the first half of the unit, when students are building the foundational understanding they'll apply to more complex tasks later.
The 8th grade functions worksheets printable in this set also address the second cluster, 8.F.B, which asks students to construct a function from a verbal description or table (8.F.B.4) and to describe functional relationships qualitatively from a graph — increasing, decreasing, linear, nonlinear — without necessarily calculating values (8.F.B.5). The equation-writing and graph-description worksheets align here and work best in the second half of the unit, when students shift from classifying relationships to analyzing them.
How to Adjust the Set for a Mixed-Readiness Classroom
Grade 8 math classes routinely span three to four years of preparation differences. The worksheets in this set hold up across that range without requiring completely separate materials for each group. The most efficient approach is to start everyone on the same worksheet, vary how far each group goes, and reserve a challenge item at the end for students who finish early.
For students who need more support, table-based worksheets with whole-number inputs and outputs are the right entry point. Partially completed mapping diagrams reduce the setup work required before students can reason about the math itself. Keeping focus on one representation at a time prevents working memory demands from overriding the conceptual task.
For students ready for more challenge, comparison worksheets are the most productive. A strong extension is asking students to construct a function of their own that satisfies given constraints — for example, a function where f(0) = 3 and the rate of change is negative — and then represent it as both a table and an equation. That task requires working backward from properties, which is a fundamentally different cognitive demand than identification or evaluation work.
Frequently Asked Questions
My students can identify functions from tables but fall apart on graphs. What's causing that?
This gap appears in most function units and has a specific cause. Reading a table means checking rows one at a time — one input, one output, row by row — which mirrors the definition directly. Reading a graph requires translating a continuous visual image into discrete input-output pairs, which is a separate skill. Students who haven't made that translation explicitly tend to apply the vertical line test as a memorized step without connecting it to what they already know about the definition. Worksheets that show the same function as both a table and a graph, and ask students to verify both forms against the definition, close this gap faster than additional graph-only repetition.
Do these worksheets include nonlinear functions?
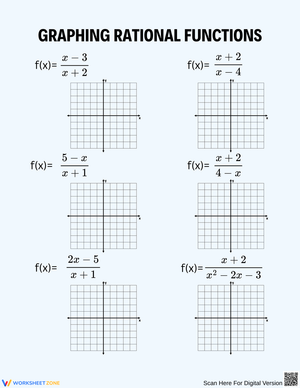
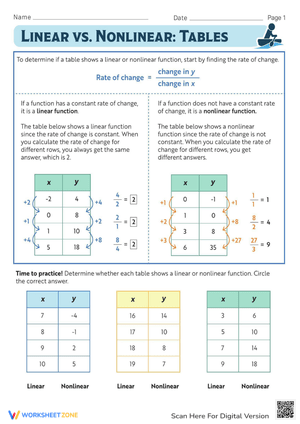
Yes. While most tasks involve linear relationships, some worksheets include graphs and tables that show nonlinear patterns — a quadratic-shaped curve, for example — and ask students to classify the relation as a function and note whether the rate of change is constant or varying. This connects to 8.F.B.5 and prepares students for the function work they'll encounter in 9th grade algebra.
Can I use these as formative checks without grading every item?
Using 8th grade functions worksheets printable for informal formative checks is one of the most practical applications in the set. A 6- to 8-item worksheet becomes a useful class read when students complete the first four items independently and use the last two as an exit discussion or partner review. The answer key makes class-wide patterns visible immediately — if most students answer the first three items correctly and most miss item four, that tells you exactly what to address the next day, without formal grading required.