


0
Views
0
Downloads
0.0
0
Save
0 Likes
Graphing Rational Functions with X-Intercepts
0 Views
0 Downloads
Paste this activity's link or code into your existing LMS (Google Classroom, Canvas, Teams, Schoology, Moodle, etc.).
Students can open and work on the activity right away, with no student login required.
You'll still be able to track student progress and results from your teacher account.
Information
Description
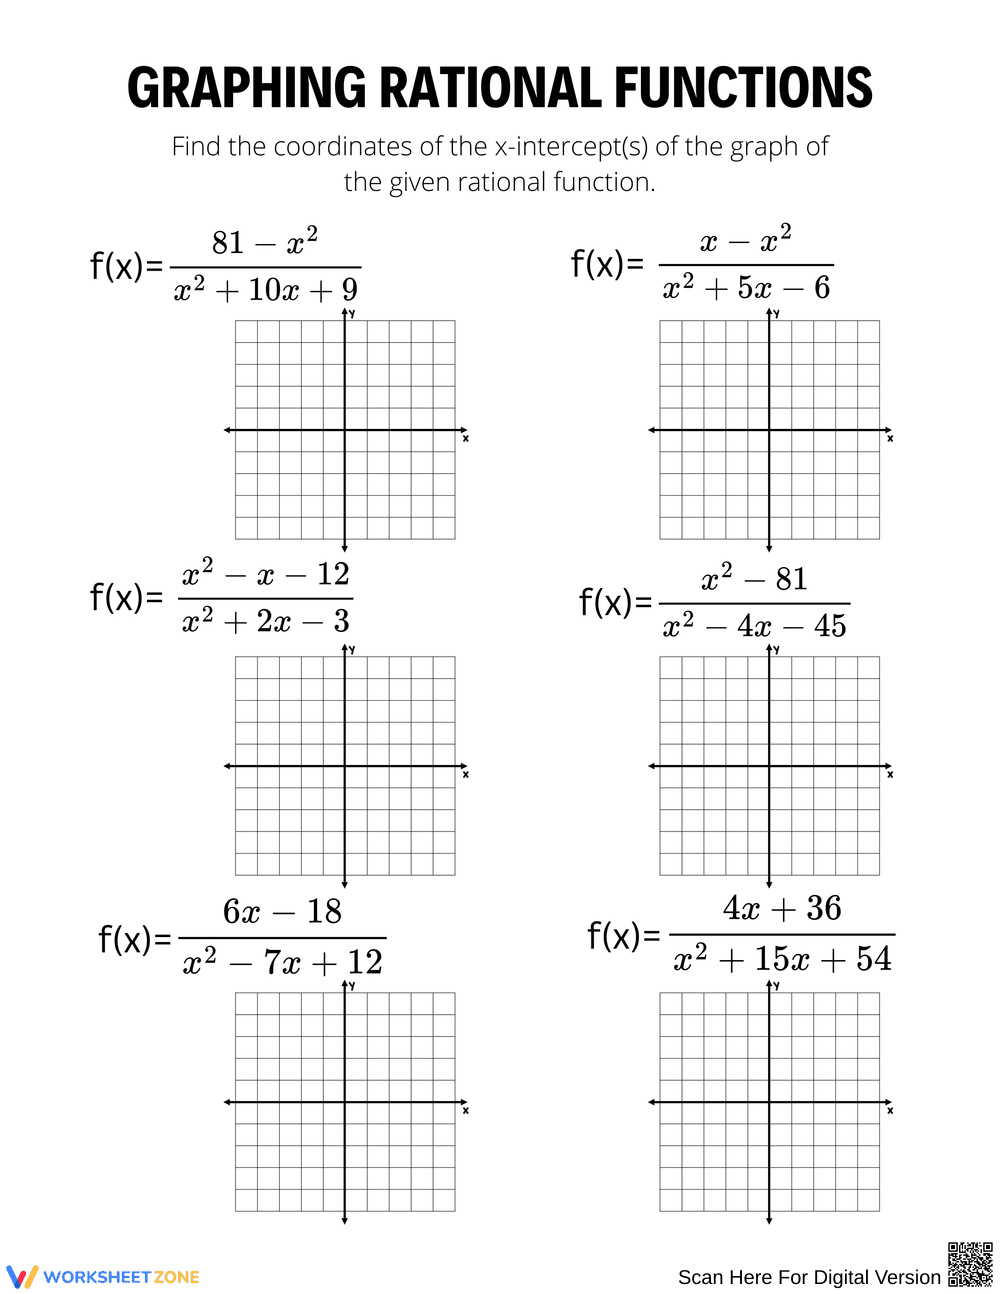
What It Is:
This worksheet focuses on graphing rational functions by finding the x-intercepts of various equations. It includes visual grids for plotting points and analyzing behavior.
Why Use It:
This activity enhances understanding of rational functions, promotes critical thinking, and develops graphing skills.
How to Use It:
• Identify the given function.
• Calculate x-intercepts.
• Plot the intercepts on the grid provided.
Grade Suitability:
Best for Grade 8 - Grade 11.
• Younger kids focus area: Understanding functions.
• Older students focus area: Graphing and interpreting rational functions.
Target Users:
This worksheet is ideal for teachers and students in algebra or precalculus courses.