


1 / 2
0
Views
0
Downloads
0.0
0
Save
0 Likes
Comparing Functions Practice Worksheet
0 Views
0 Downloads
Paste this activity's link or code into your existing LMS (Google Classroom, Canvas, Teams, Schoology, Moodle, etc.).
Students can open and work on the activity right away, with no student login required.
You'll still be able to track student progress and results from your teacher account.
Information
Description
What It Is:
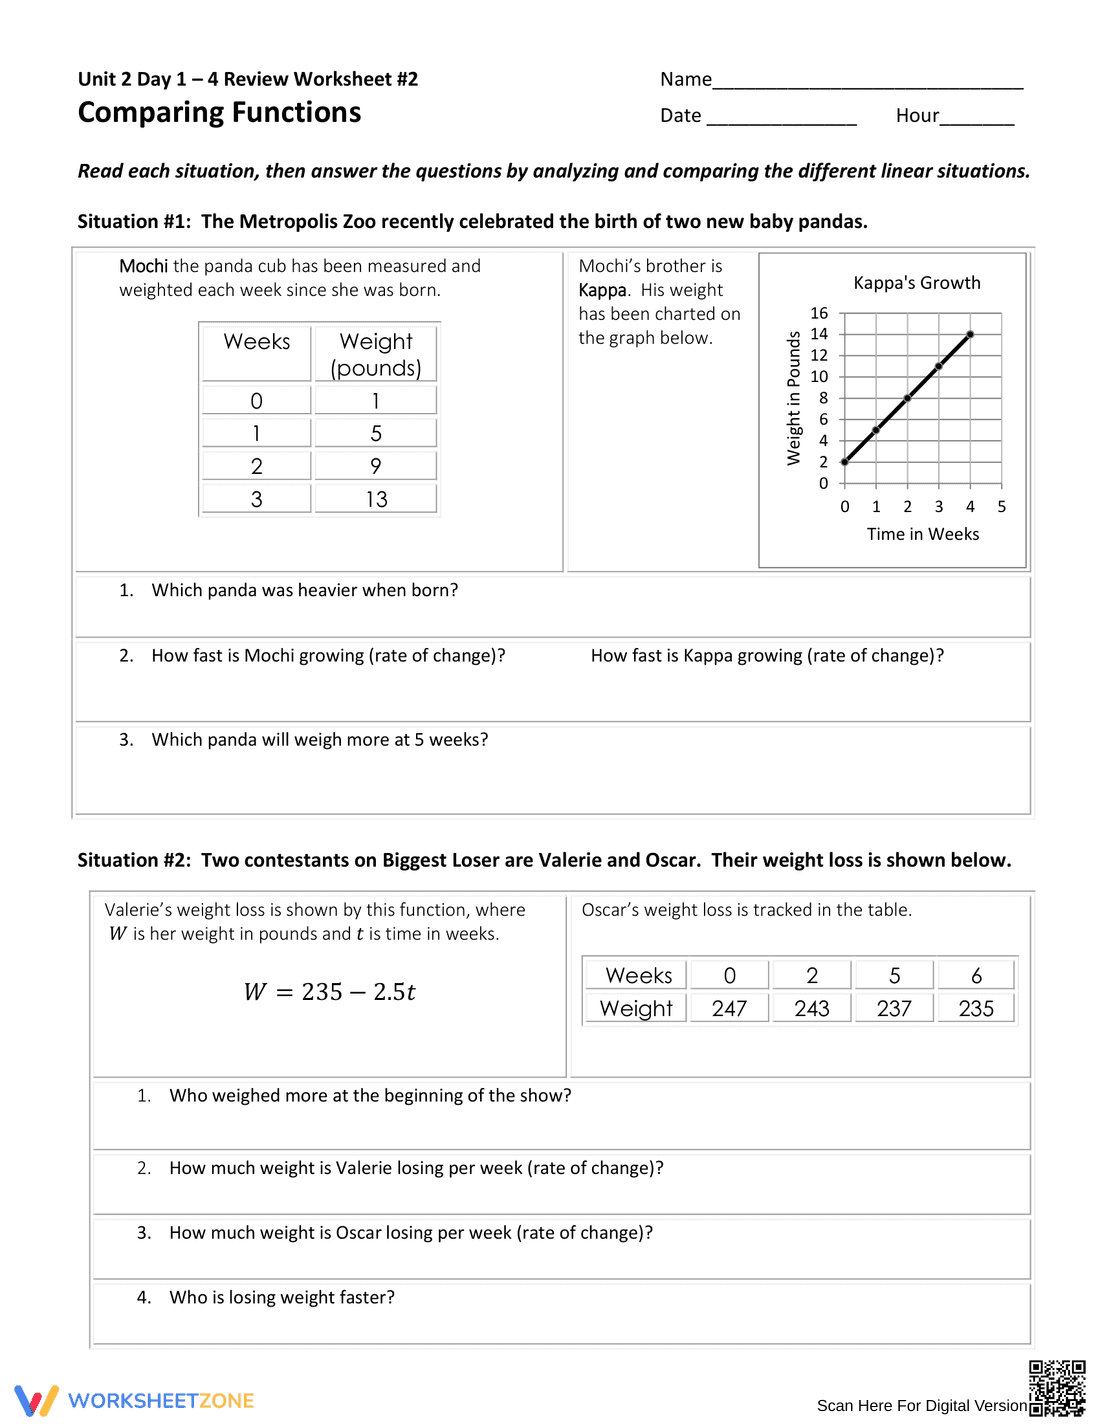
This is an educational worksheet focusing on comparing functions. It presents two different scenarios. The first scenario involves comparing the growth of two pandas, Mochi and Kappa. Mochi's growth is represented in a table showing weeks and weight, while Kappa's growth is shown on a line graph. Students are asked to compare their weights and rates of change. The second scenario involves two contestants on 'Biggest Loser,' Valerie and Oscar, and their weight loss. Valerie's weight loss is represented by a linear equation, and Oscar's weight loss is shown in a table. Students are asked to compare their initial weights, rates of weight loss, and determine who is losing weight faster.
Grade Level Suitability:
This worksheet is suitable for grades 7-9. It requires understanding of linear functions, interpreting graphs and tables, and calculating rates of change. The scenarios presented are relatable and provide context for applying these mathematical concepts.
Why Use It:
This worksheet helps students develop skills in comparing and analyzing linear functions presented in different formats (tables, graphs, equations). It reinforces the concept of rate of change in a real-world context and promotes critical thinking by requiring students to draw conclusions based on the data provided. It also helps students practice interpreting data and applying mathematical concepts to solve problems.
How to Use It:
Students should read each scenario carefully and analyze the data presented. For the panda scenario, they need to compare the table and the graph to answer questions about initial weights and rates of growth. For the weight loss scenario, they need to extract information from the equation and the table to compare initial weights and rates of weight loss. Students should show their work and provide clear explanations for their answers.
Target Users:
This worksheet is ideal for students who are learning about linear functions, rates of change, and data interpretation. It is suitable for classroom use, homework assignments, or review activities. It can also be used by tutors or parents who want to provide additional practice in these areas.