These 6th grade stem and leaf plot pdf worksheets give teachers a structured way to move students from raw number lists to organized, interpretable data displays—without losing the actual values in the process. Each worksheet targets a specific step in that progression: reading a completed plot, repairing a partial one, constructing from scratch, and answering analysis questions that require more than just placing digits correctly.
The Specific Skills Each Worksheet Targets
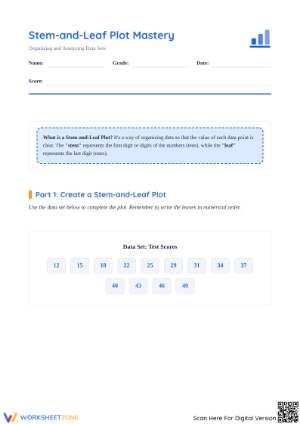
Stem-and-leaf plots sit at a useful intersection of place value and data reasoning. A student who can't explain why the stem represents the tens digit—or why 3|8 means 38 and not 83—hasn't really understood the display. These worksheets surface that kind of surface-level procedural knowledge early, before it becomes invisible on a quiz.
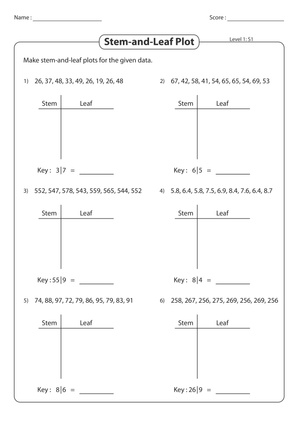
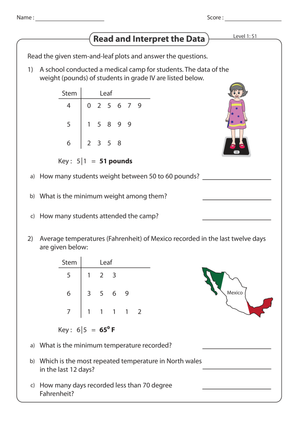
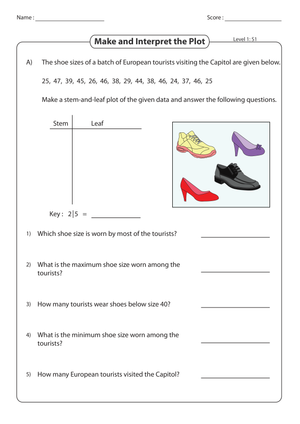
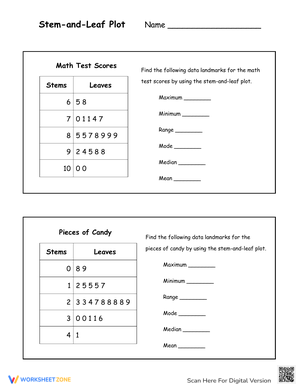
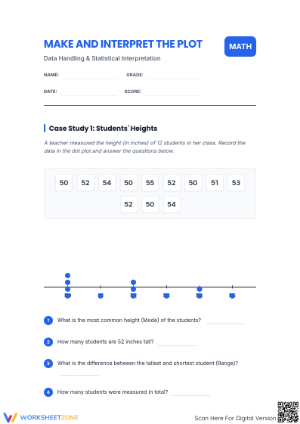
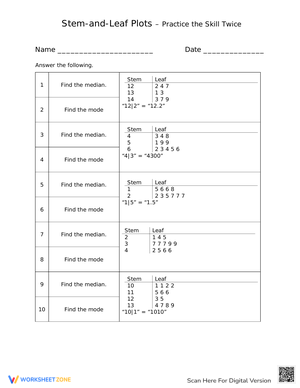
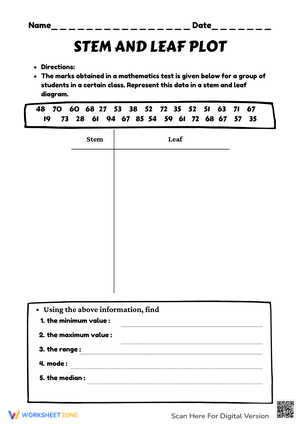
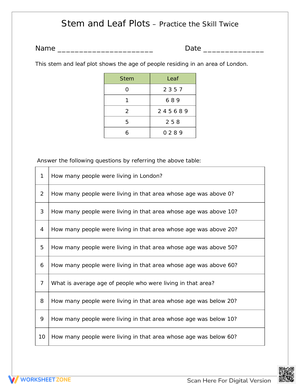
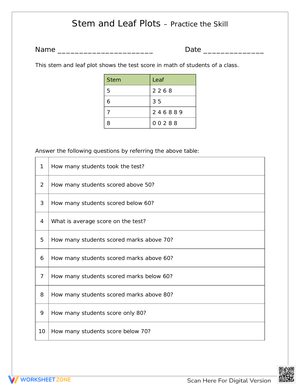
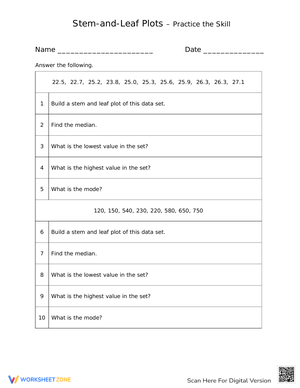
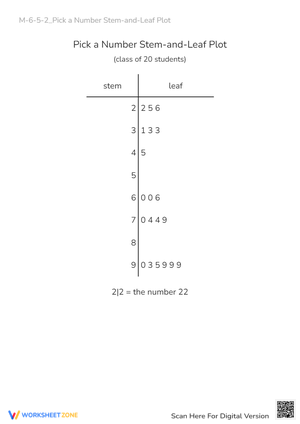
- Reading completed plots: Students identify individual data values, count total data points, and locate the least and greatest values in the set.
- Repairing partial or incorrect plots: Students add missing leaves, reorder misplaced digits, and account for repeated values that appear more than once.
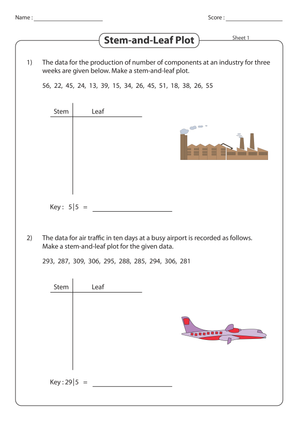
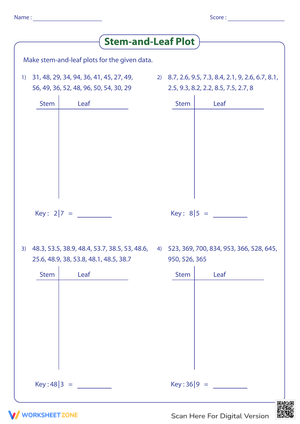
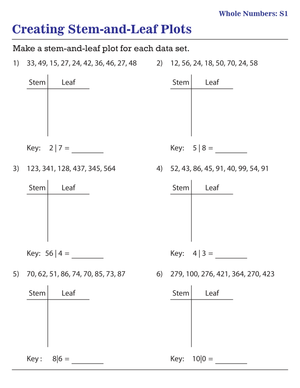
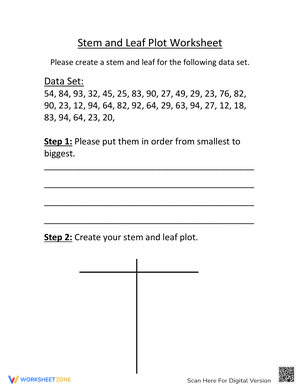
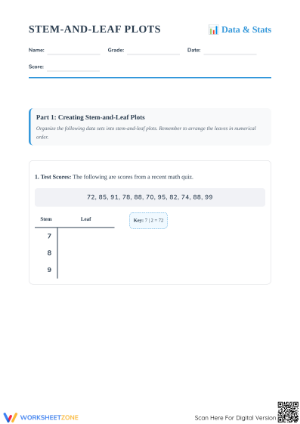
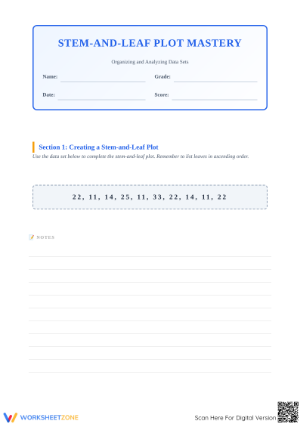
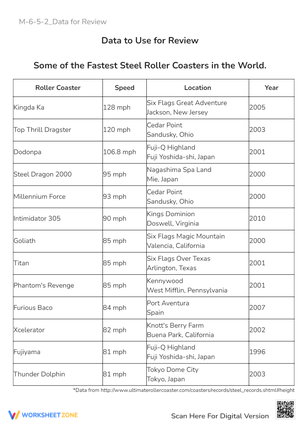
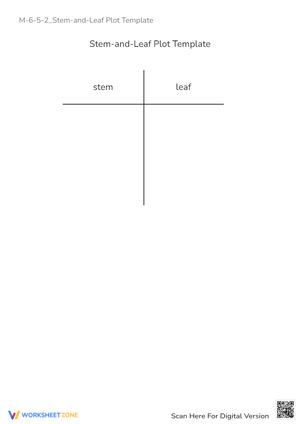
- Building plots from raw data: Students sort numbers by stem, sequence the leaves from least to greatest, and write a complete key—such as 4|7 = 47.
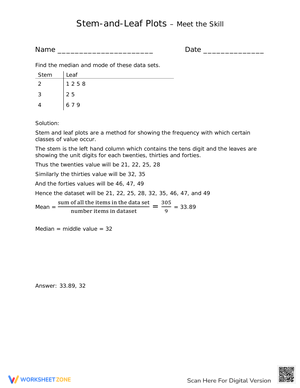
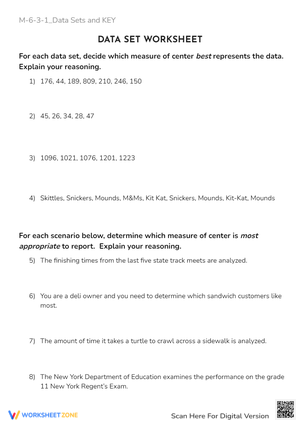
- Interpreting the display: Students calculate range, identify the median, name the mode, and describe clusters or gaps in the data.
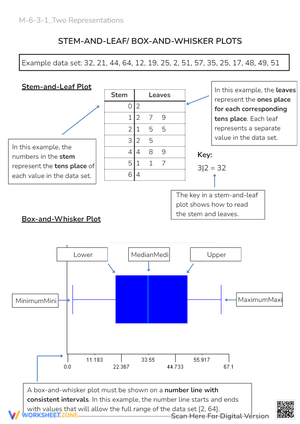
- Comparing two data sets: Students work with back-to-back plots and describe differences in spread or center.
Mixing these question types within the set reveals a useful diagnostic split: a student who constructs a plot correctly but misidentifies the median is struggling with data reasoning, not place value. That distinction is worth knowing before the unit test.
Frequent Student Errors Worth Watching For
The most common mistake is also the easiest to miss on a quick scan: leaves recorded in the order the teacher read the data aloud rather than in ascending order within each row. A student might place 3, 7, 1, 9 in the "4" stem row instead of 1, 3, 7, 9—and then find an incorrect median because the position of the middle value shifts. The plot looks populated. The answer is still wrong.
A second reliable error is omitting the key entirely. Students who understand how to place digits sometimes treat the key as optional. It isn't. A plot showing 4|7 with no key is unreadable—teachers should treat a missing key as an incomplete response, not a minor oversight, and the worksheets reinforce that expectation throughout.
Two other patterns appear consistently in student work at this level:
- Dropped repeated values: If 34 appears three times in the raw data, the leaf row for stem 3 should contain three 4s. Students frequently write only one.
- Wrong stem split: For three-digit numbers, some students aren't sure whether the stem should carry one digit or two. A brief worked example at the top of the worksheet prevents this before it compounds into a disorganized plot.
How to Work These Worksheets Into Your Week
These 6th grade stem and leaf plot pdf worksheets fit several distinct spots in a typical instructional week. One worksheet makes a clean warm-up for the first five or six minutes of class: project a completed plot, give students two minutes to answer three questions—least value, range, median—then review together before the main lesson. That routine works especially well on days when new content extends the same idea, such as moving from reading plots to building them.
For center rotations, one station can use data cards that students sort into a plot on a half-sheet, while a second station presents a finished plot with interpretation questions. The two stations cover construction and analysis without requiring the teacher to introduce a new format mid-rotation. Because each worksheet stands alone and the directions are self-contained, they also hold up in sub plans without extra preparation.
One classroom move that consistently improves accuracy: before students begin building a plot, have them lightly rewrite the raw data in ascending order on a scratch line first. This costs about ninety seconds and reduces misplaced leaves, makes repeated values easy to spot, and frees students from sorting mentally while also writing—two tasks that compete for attention at the same time. It isn't a shortcut. It's the same move a data analyst makes before entering numbers into any organized display.
Standard Alignment
These worksheets align to CCSS 6.SP.B.4, which asks students to display numerical data in plots on a number line, dot plots, histograms, and stem-and-leaf displays. In most sixth-grade units, stem-and-leaf plots appear after students have worked with measures of center and spread but before they encounter histograms. Placing this practice at that point lets students see the connection between the visual display and the statistics they've already calculated—range and median become visible in the plot's structure rather than just computed from a list.
Differentiating the Set Across Ability Levels
Students still solidifying two-digit place value work best with data sets limited to values between 10 and 99, where every stem is a single tens digit. Providing a partially labeled worksheet—stems already printed, leaf rows blank—removes one layer of decision-making and keeps attention on ordering and key-writing. That format works well early in the unit or for students who need more time with the procedural steps before adding interpretation questions on top.
Students who are ready for more challenge can work with three-digit data sets, where the stem carries both the hundreds and tens digits together, or with back-to-back plots that ask them to compare two distributions. A follow-up prompt like "Write two observations about what this plot shows that the range alone doesn't tell you" pushes students toward genuine statistical reasoning rather than numerical retrieval. These 6th grade stem and leaf plot pdf worksheets include enough writing space in each leaf row for students to enter digits legibly, which matters because a crowded plot is harder to self-check—and self-checking is where much of the learning actually happens.
Frequently Asked Questions
Do students need to know median and range before starting these worksheets?
Familiarity with range and median helps, especially for interpretation sections. That said, the reading and construction worksheets work well before those measures are formally introduced. Teachers can assign them in sequence—holding interpretation questions until the statistics vocabulary is in place—without disrupting the pacing of the unit.
What data sets work best for sixth graders building plots for the first time?
Whole numbers between 10 and 79 keep the stems manageable and familiar. Quiz scores, daily temperatures, or books read over a month all give students a recognizable context. Avoid data sets with outliers far outside the main cluster on a first attempt—the structural challenge of building the plot is enough without also asking students to explain why one stem row has twelve leaves and another has zero.
Can these worksheets serve as assessments rather than just practice?
Each worksheet functions well as a stand-alone formative check. A construction-and-interpretation task—raw data in, completed plot and three analysis questions out—gives a clear picture of mastery in about ten minutes. The 6th grade stem and leaf plot pdf worksheets in this set are formatted cleanly enough to use one as an exit ticket without any additional prep on the teacher's part.
How do I help students remember to include the key?
Frame the key as a translation rule, not a label. Ask students: "If someone who has never seen this plot looks at 4|7, what number do they think that is?" That question usually makes the necessity concrete in a way that repeating the instruction doesn't. Treating a missing key as an automatically incomplete response on any graded work also establishes the expectation fast.