


Views
Downloads
Essential Stem-and-Leaf Plot Practice | Grade 6 Math
Paste this activity's link or code into your existing LMS (Google Classroom, Canvas, Teams, Schoology, Moodle, etc.).
Students can open and work on the activity right away, with no student login required.
You'll still be able to track student progress and results from your teacher account.
This comprehensive math resource empowers students to organize and interpret complex numerical data sets using stem-and-leaf plots. By bridging the gap between raw numbers and visual representation, learners develop critical statistical reasoning skills. Students will move beyond simple data entry to master the nuances of range, median, and data distribution through structured practice.
At a Glance
- Grade: 4–6 · Subject: Math
- Standard:
CCSS.MATH.CONTENT.6.SP.B.4— Organize numerical data into plots to identify range and median- Skill Focus: Stem-and-leaf plot creation and analysis
- Format: 5 pages · 13 problems · Answer key included · PDF
- Best For: Independent data analysis and mastery
- Time: 25–35 minutes
What's Inside
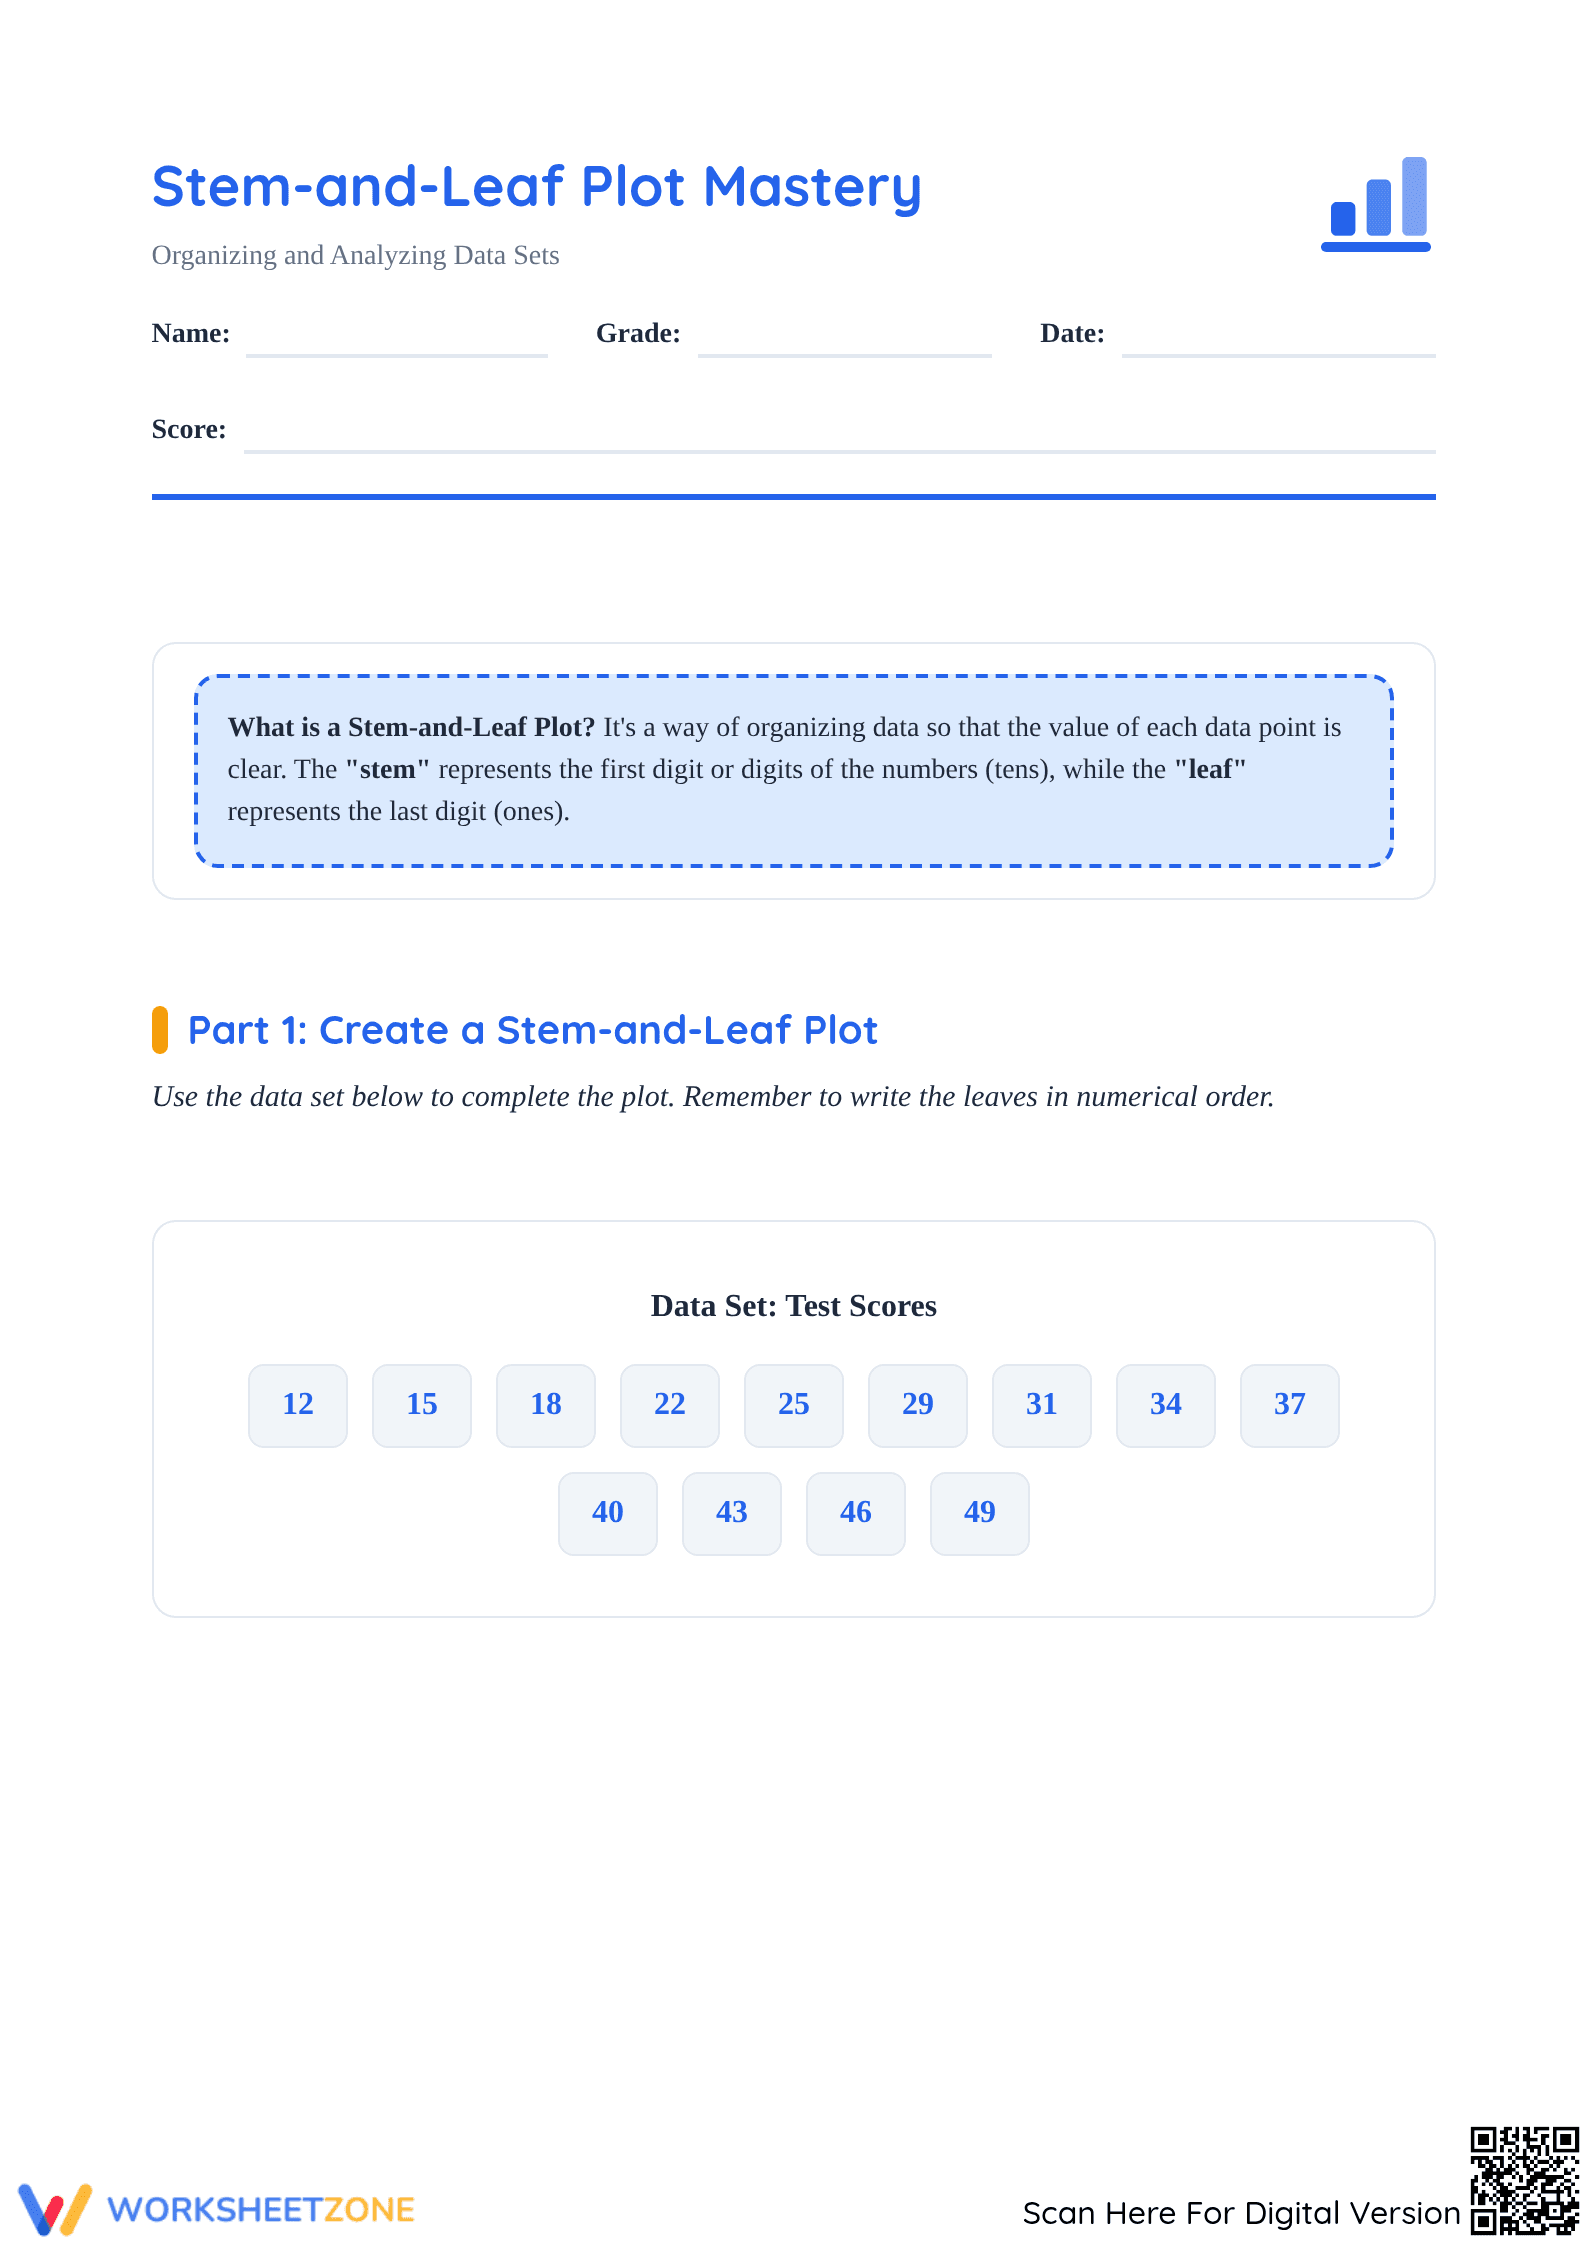
This five-page PDF features a clear instructional box defining stems and leaves, followed by four distinct parts. It includes two data sets (Test Scores and Heart Rates) for students to construct their own plots, paired with 11 analytical questions that require calculating the smallest value, largest value, range, and median. A full answer key is provided for immediate feedback and grading efficiency.
Skill Progression
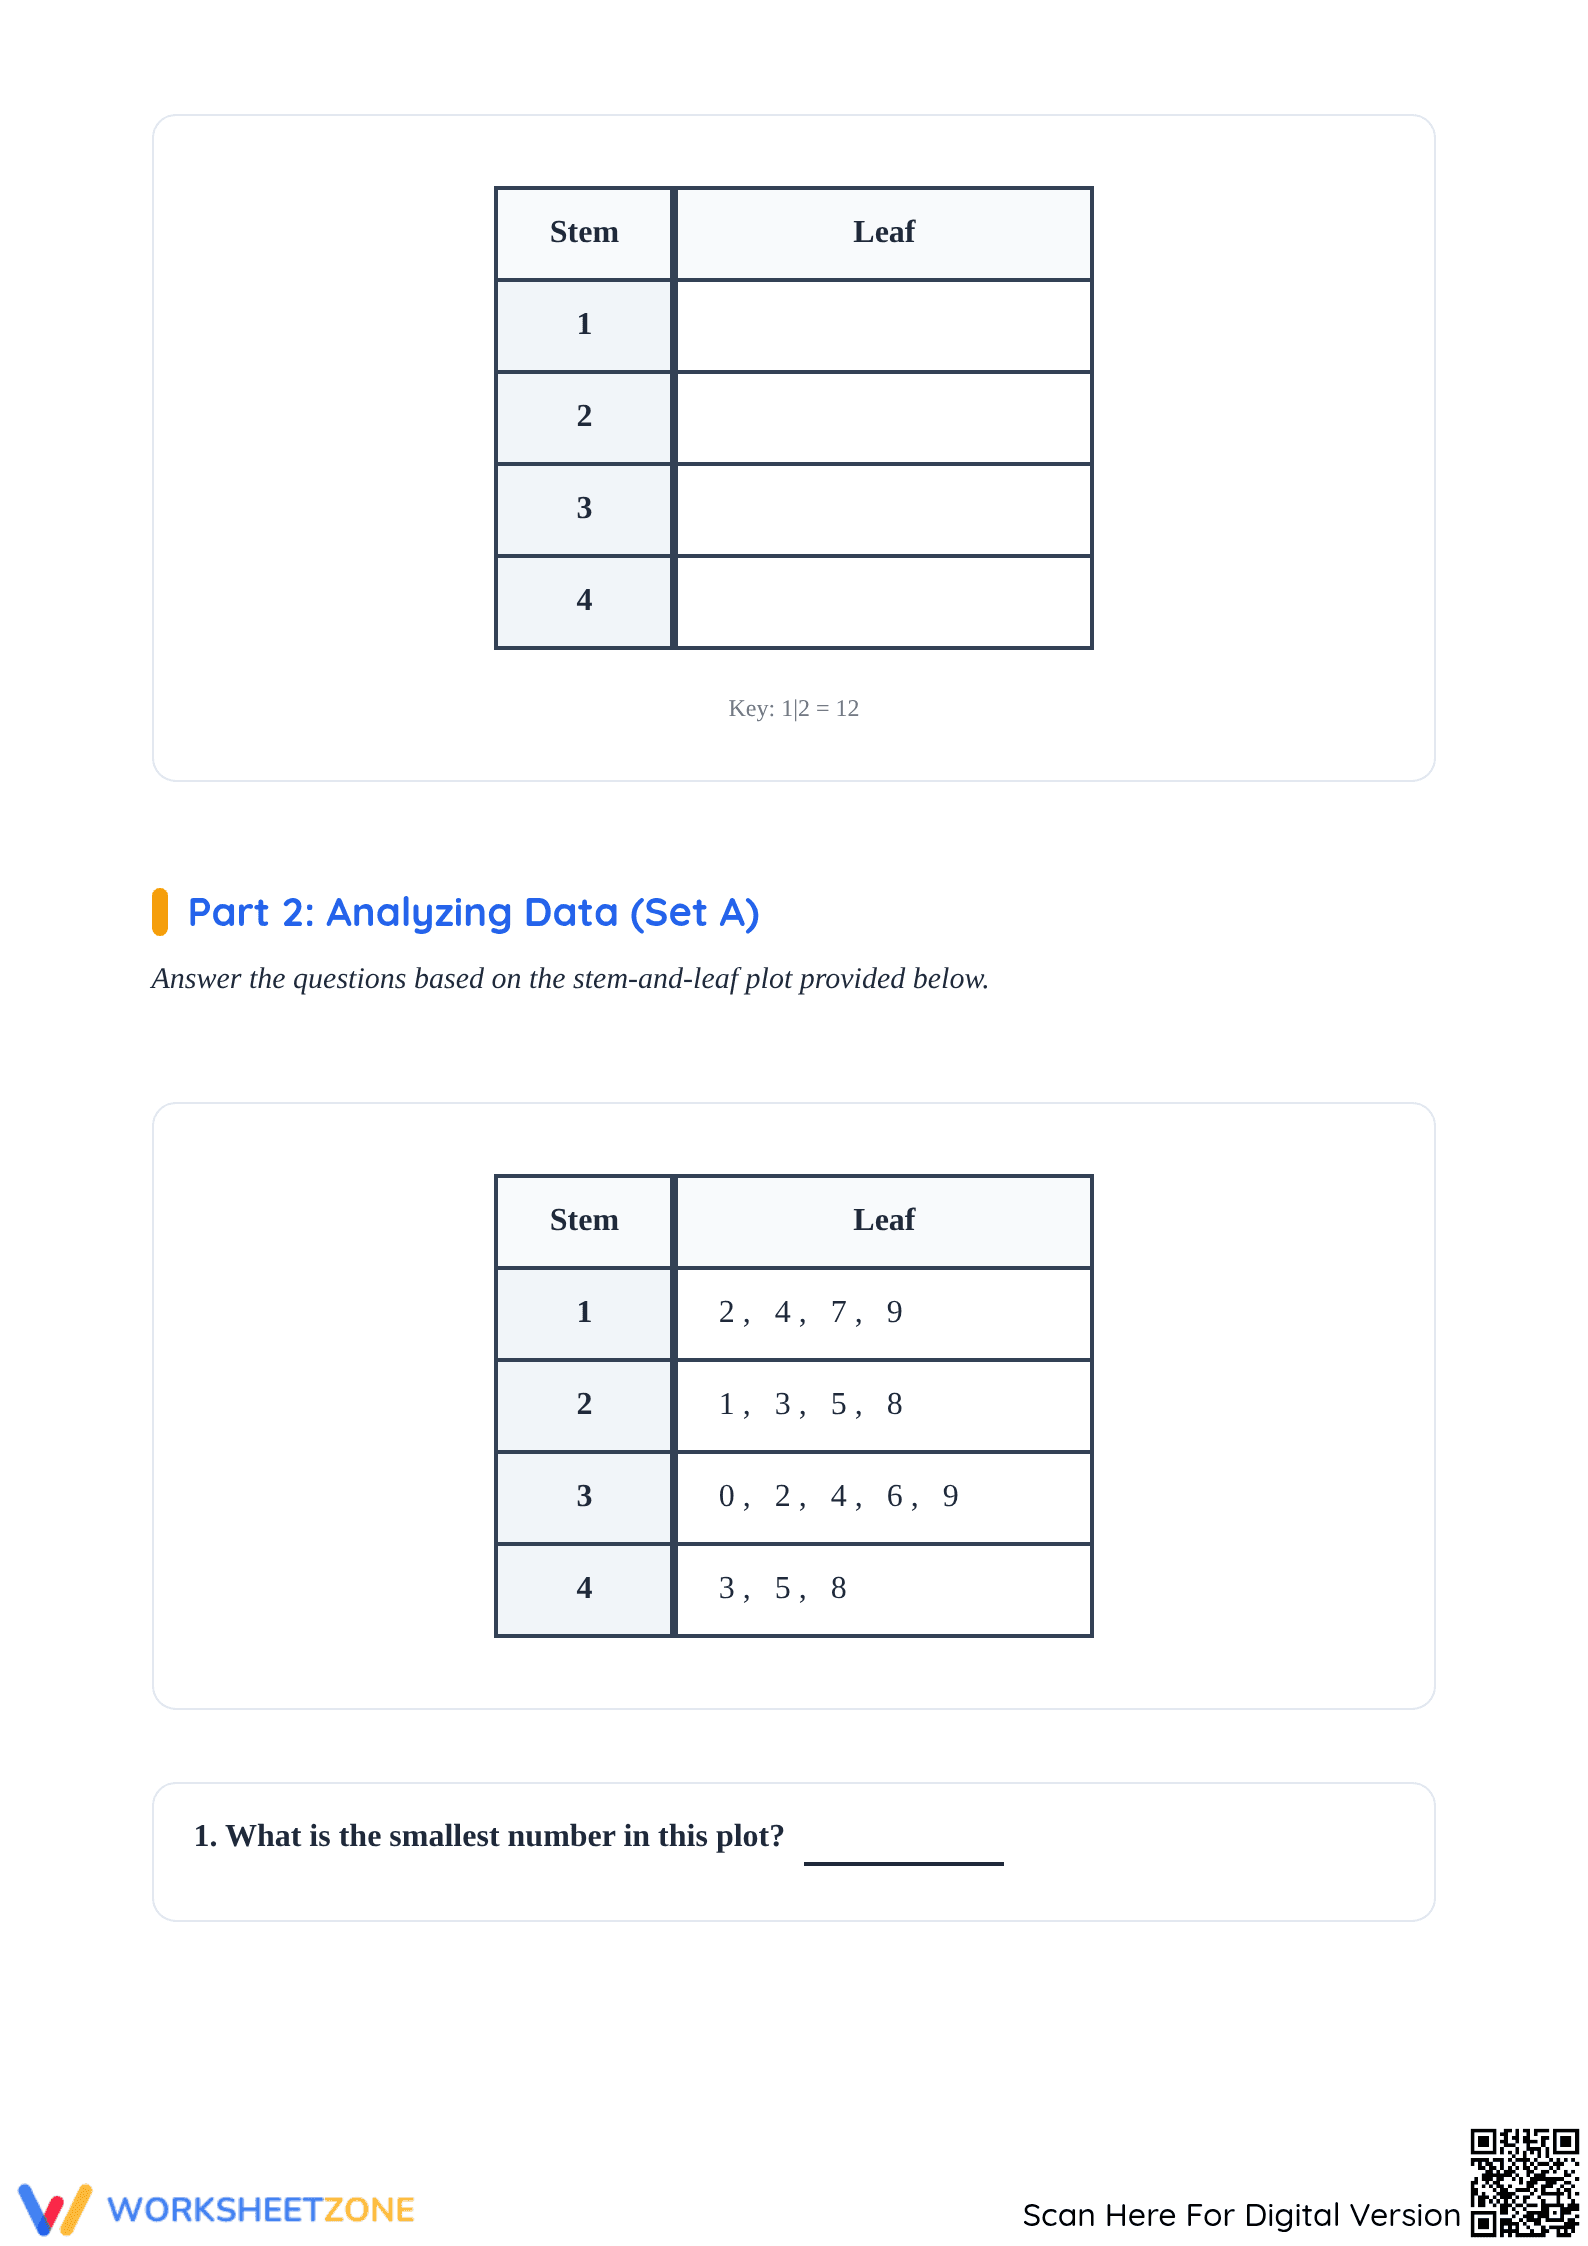
- Guided Practice: The initial section provides a structured data set and a pre-formatted stem-and-leaf table with stems (1, 2, 3, 4) already provided to lower the cognitive load for beginners.
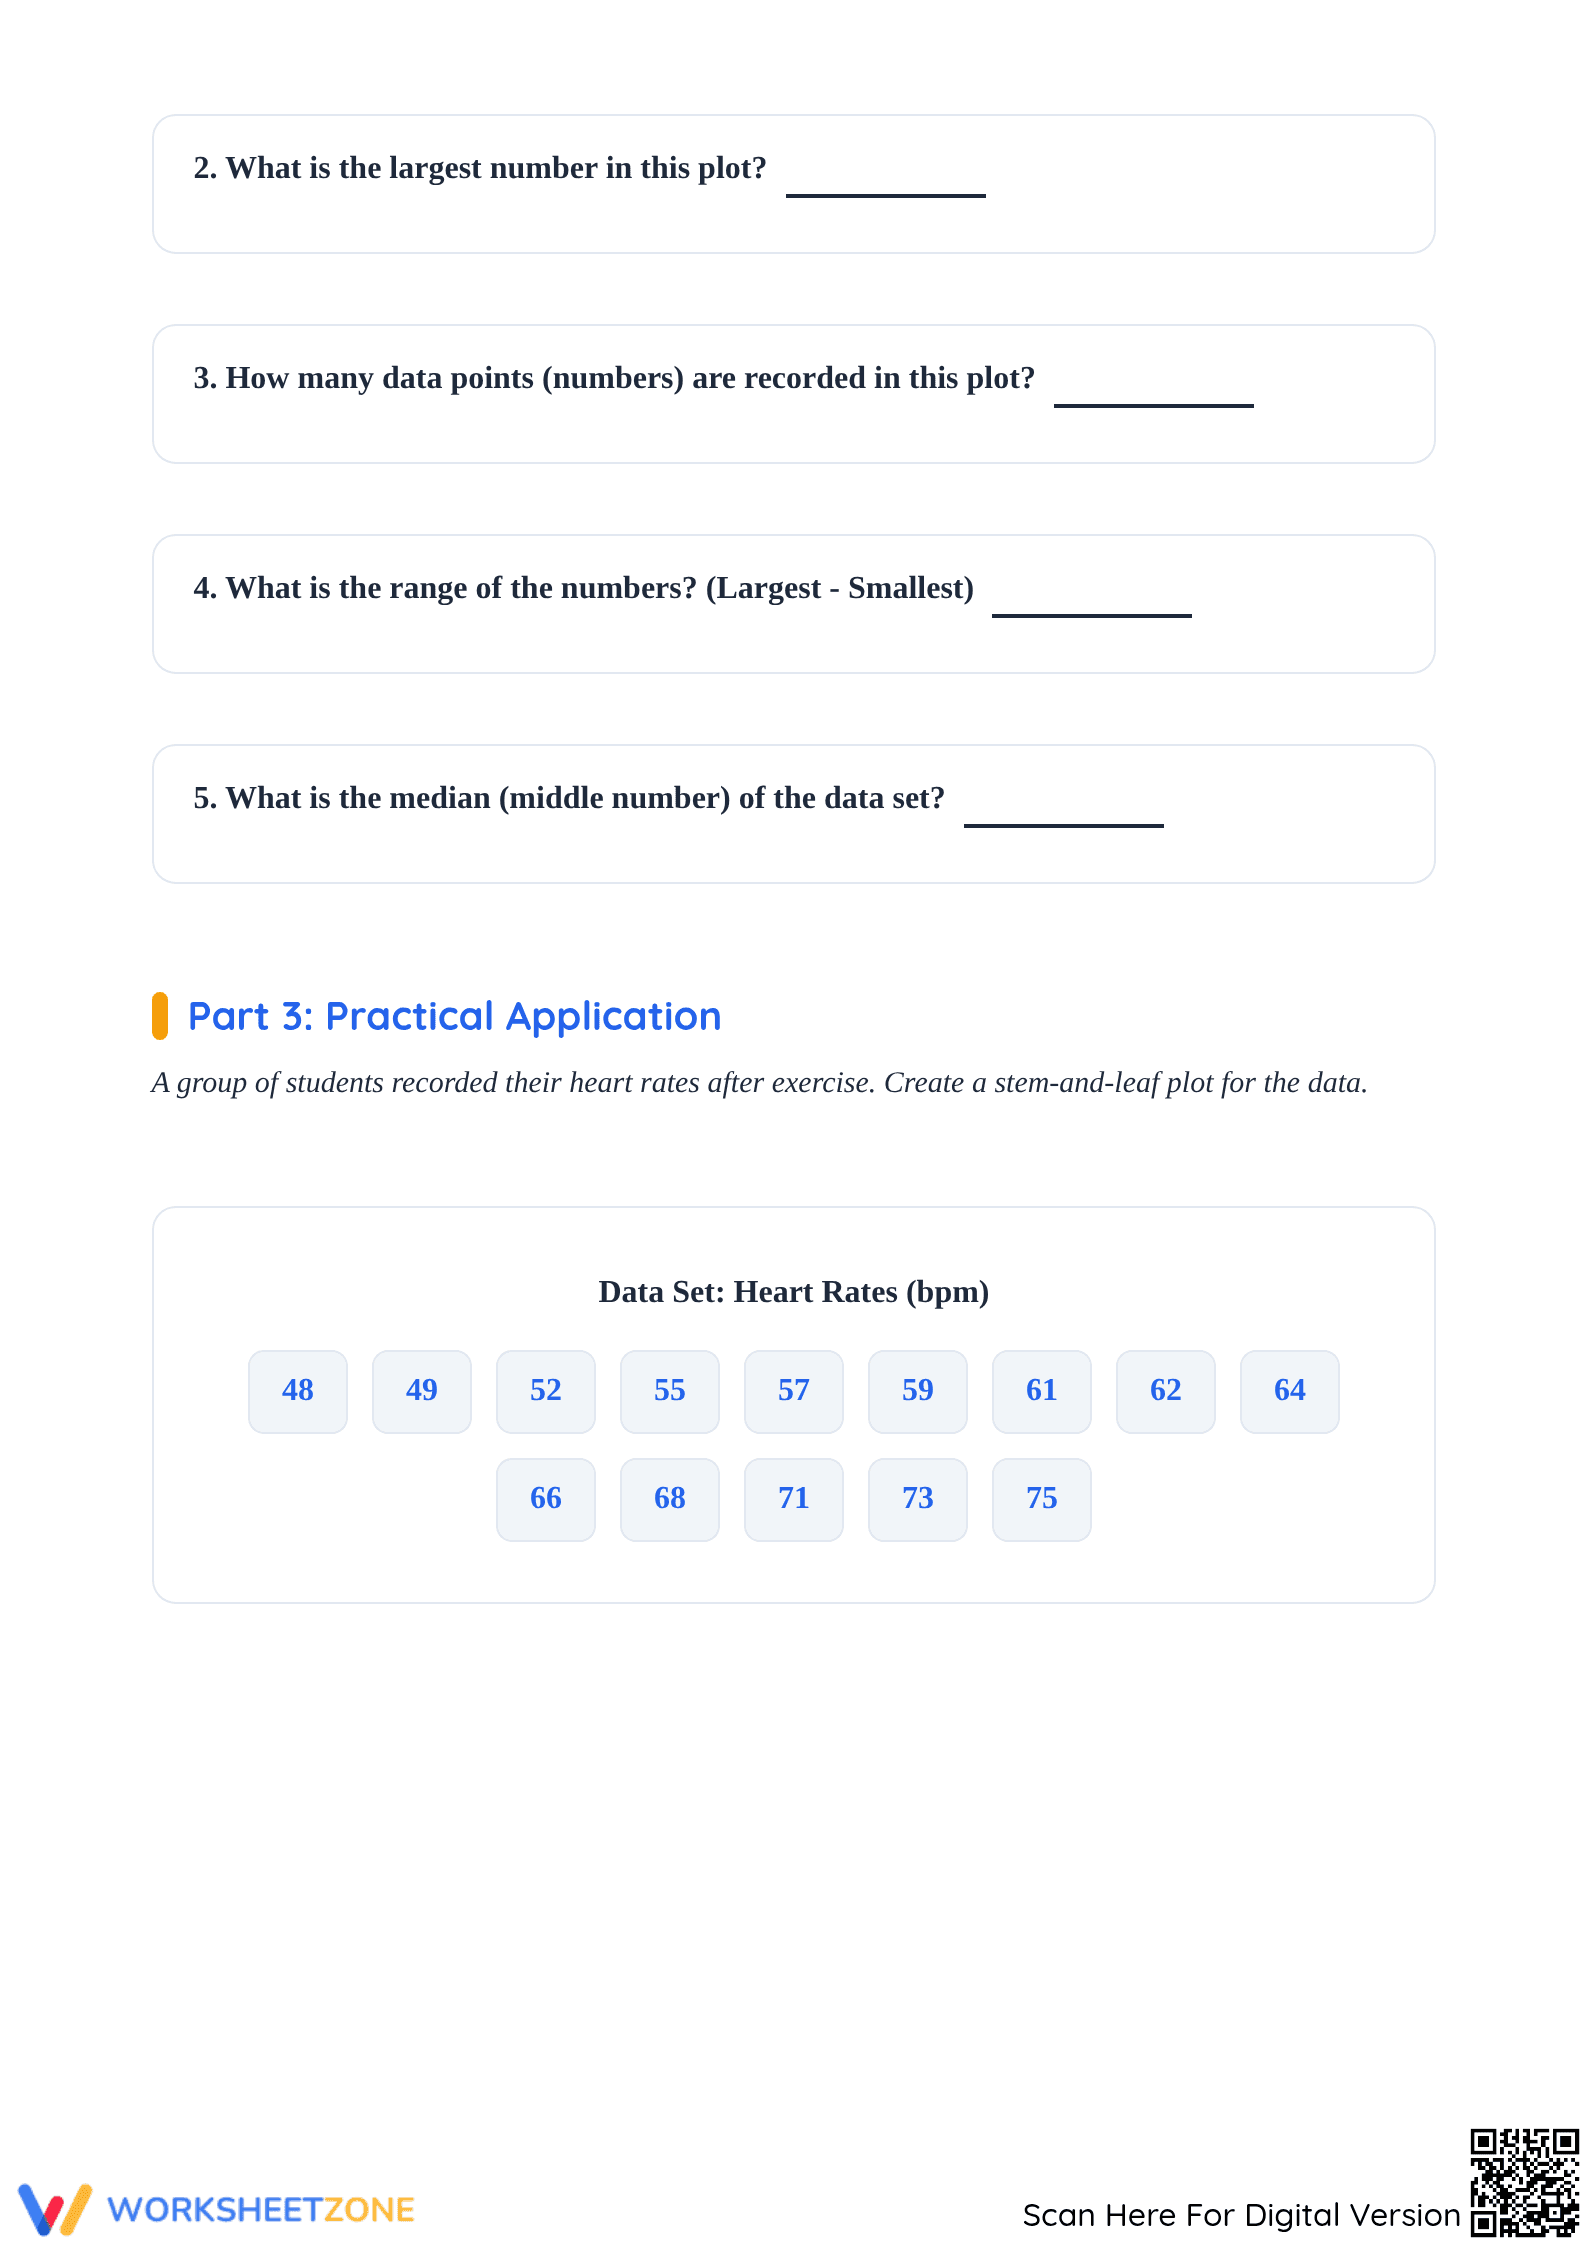
- Supported Practice: Students transition to the Heart Rates section, where they must identify appropriate stems and place leaves in numerical order with less visual scaffolding.
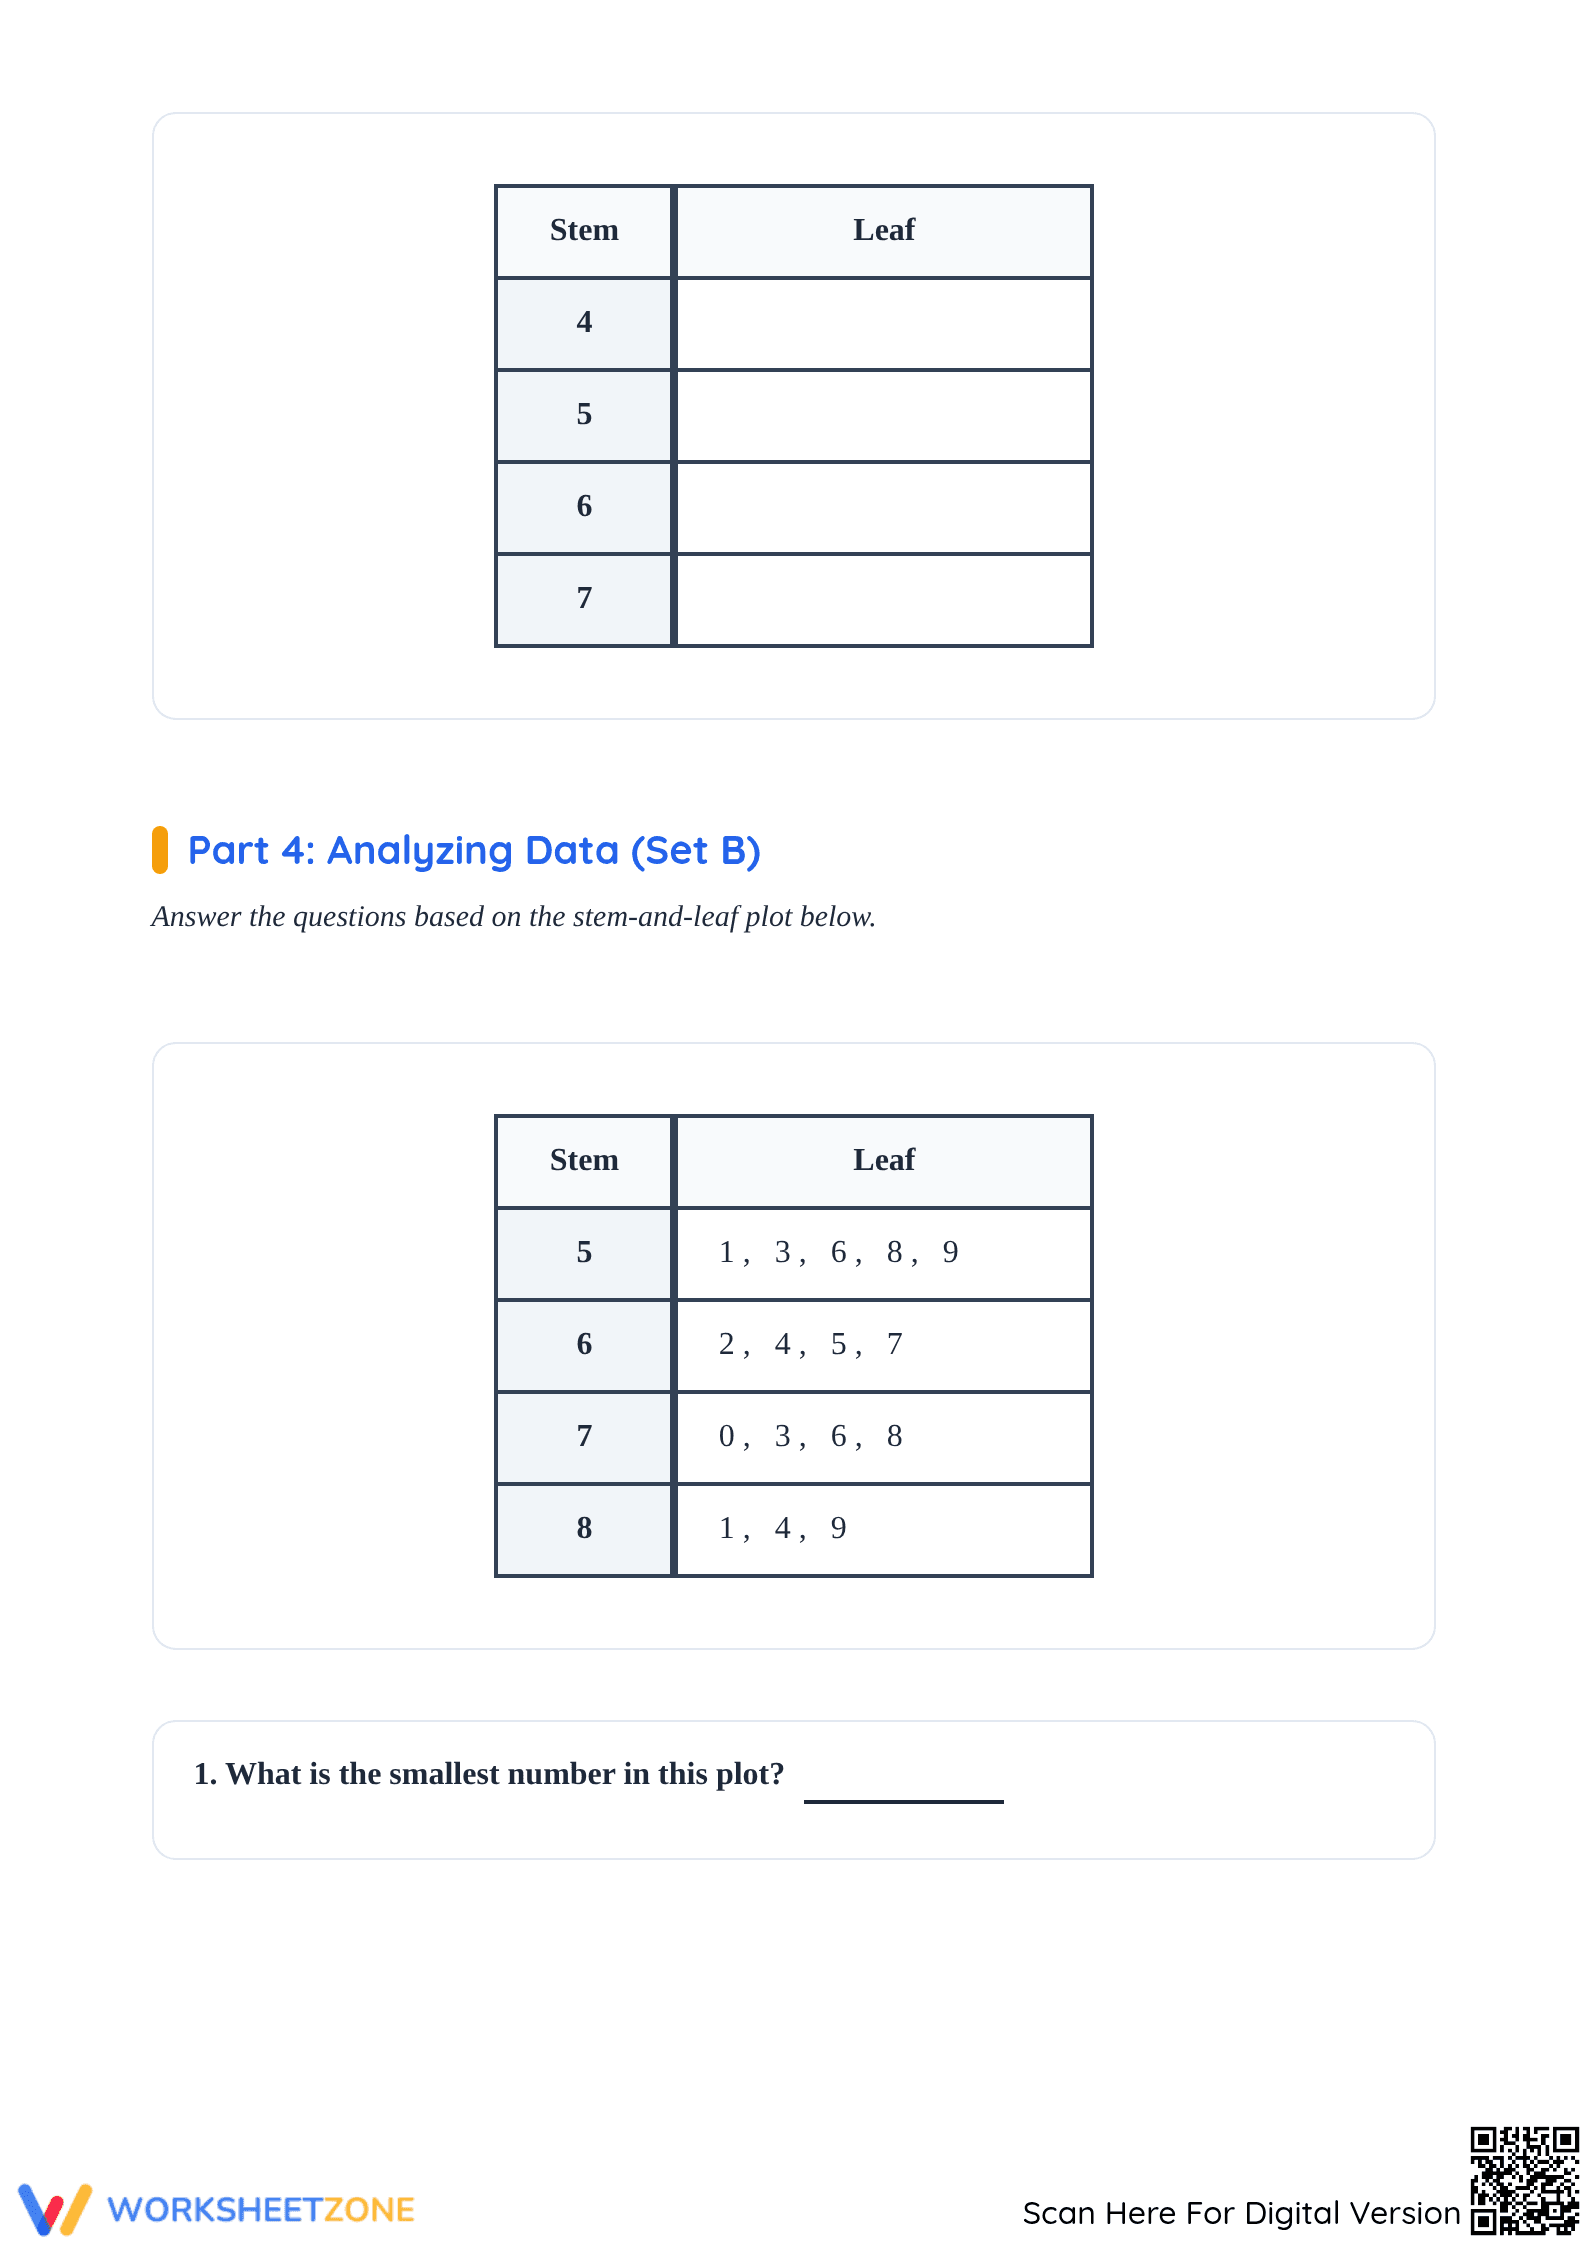
- Independent Practice: The final sets challenge students to analyze existing plots to find statistical measures and solve a bonus challenge regarding leaf frequency and data clusters.
This progression follows the gradual-release model to ensure students build conceptual confidence before tackling complex data sets independently.
Standards Alignment
The primary focus is CCSS.MATH.CONTENT.6.SP.B.4, which requires students to display numerical data in plots. Additionally, it supports CCSS.MATH.CONTENT.6.SP.B.5.C by asking students to describe the nature of the attribute under investigation, including its range and measures of center. Both standard codes can be copied directly into lesson plans, IEP goals, or district curriculum mapping tools.
How to Use It
Use this worksheet after a direct instruction lesson on data organization as an independent practice activity. It serves as an excellent formative assessment tool; teachers should observe if students are correctly ordering the leaves numerically, as this is the most common point of error. Expect students to complete the full 5-page packet in approximately 30 minutes during a standard math block.
Who It's For
This resource is designed for Grade 4 through Grade 6 students who are mastering basic statistics and data visualization. It is particularly effective for small group intervention or as a self-contained sub plan. Pair this with a real-world data collection activity, such as measuring student heights or pulse rates, to reinforce the practical utility of stem-and-leaf representations.
According to the NAEP data analysis framework, the ability to translate between raw data sets and visual displays like stem-and-leaf plots is a foundational indicator of statistical literacy. Fisher & Frey (2014) emphasize that structured practice with data representation allows students to internalize the relationship between individual data points and the overall distribution of a set. This worksheet applies these evidence-based principles by requiring students to not only create the plots but also extract meaningful statistical measures such as range and median. Research from ScienceDirect TpT Analysis suggests that multi-page data practice increases retention compared to single-task sheets. By utilizing CCSS.MATH.CONTENT.6.SP.B.4 as a target, this resource ensures that Grade 6 learners develop the precision required for higher-order algebra and statistics. The inclusion of a bonus challenge further extends student thinking into frequency identification and the conceptual understanding of data density within a specific range.