


Views
Downloads
Printable Data Interpretation Worksheet | Grade 4-8 Math
Paste this activity's link or code into your existing LMS (Google Classroom, Canvas, Teams, Schoology, Moodle, etc.).
Students can open and work on the activity right away, with no student login required.
You'll still be able to track student progress and results from your teacher account.
Master the art of data analysis with this comprehensive multi-page worksheet. Students will analyze three distinct data representations—bar graphs, pictographs, and frequency tables—to solve real-world problems. By extracting specific values and performing comparative calculations, learners develop the essential quantitative literacy required for middle school mathematics and beyond.
At a Glance
- Grade: 4-8 · Subject: Math
- Standard:
CCSS.MATH.CONTENT.3.MD.B.3— Interpret scaled bar graphs and pictographs to solve multi-step comparison problems- Skill Focus: Data Analysis & Interpretation
- Format: 4 pages · 12 problems · Answer key included · PDF
- Best For: Independent practice or formative assessment
- Time: 25–35 minutes
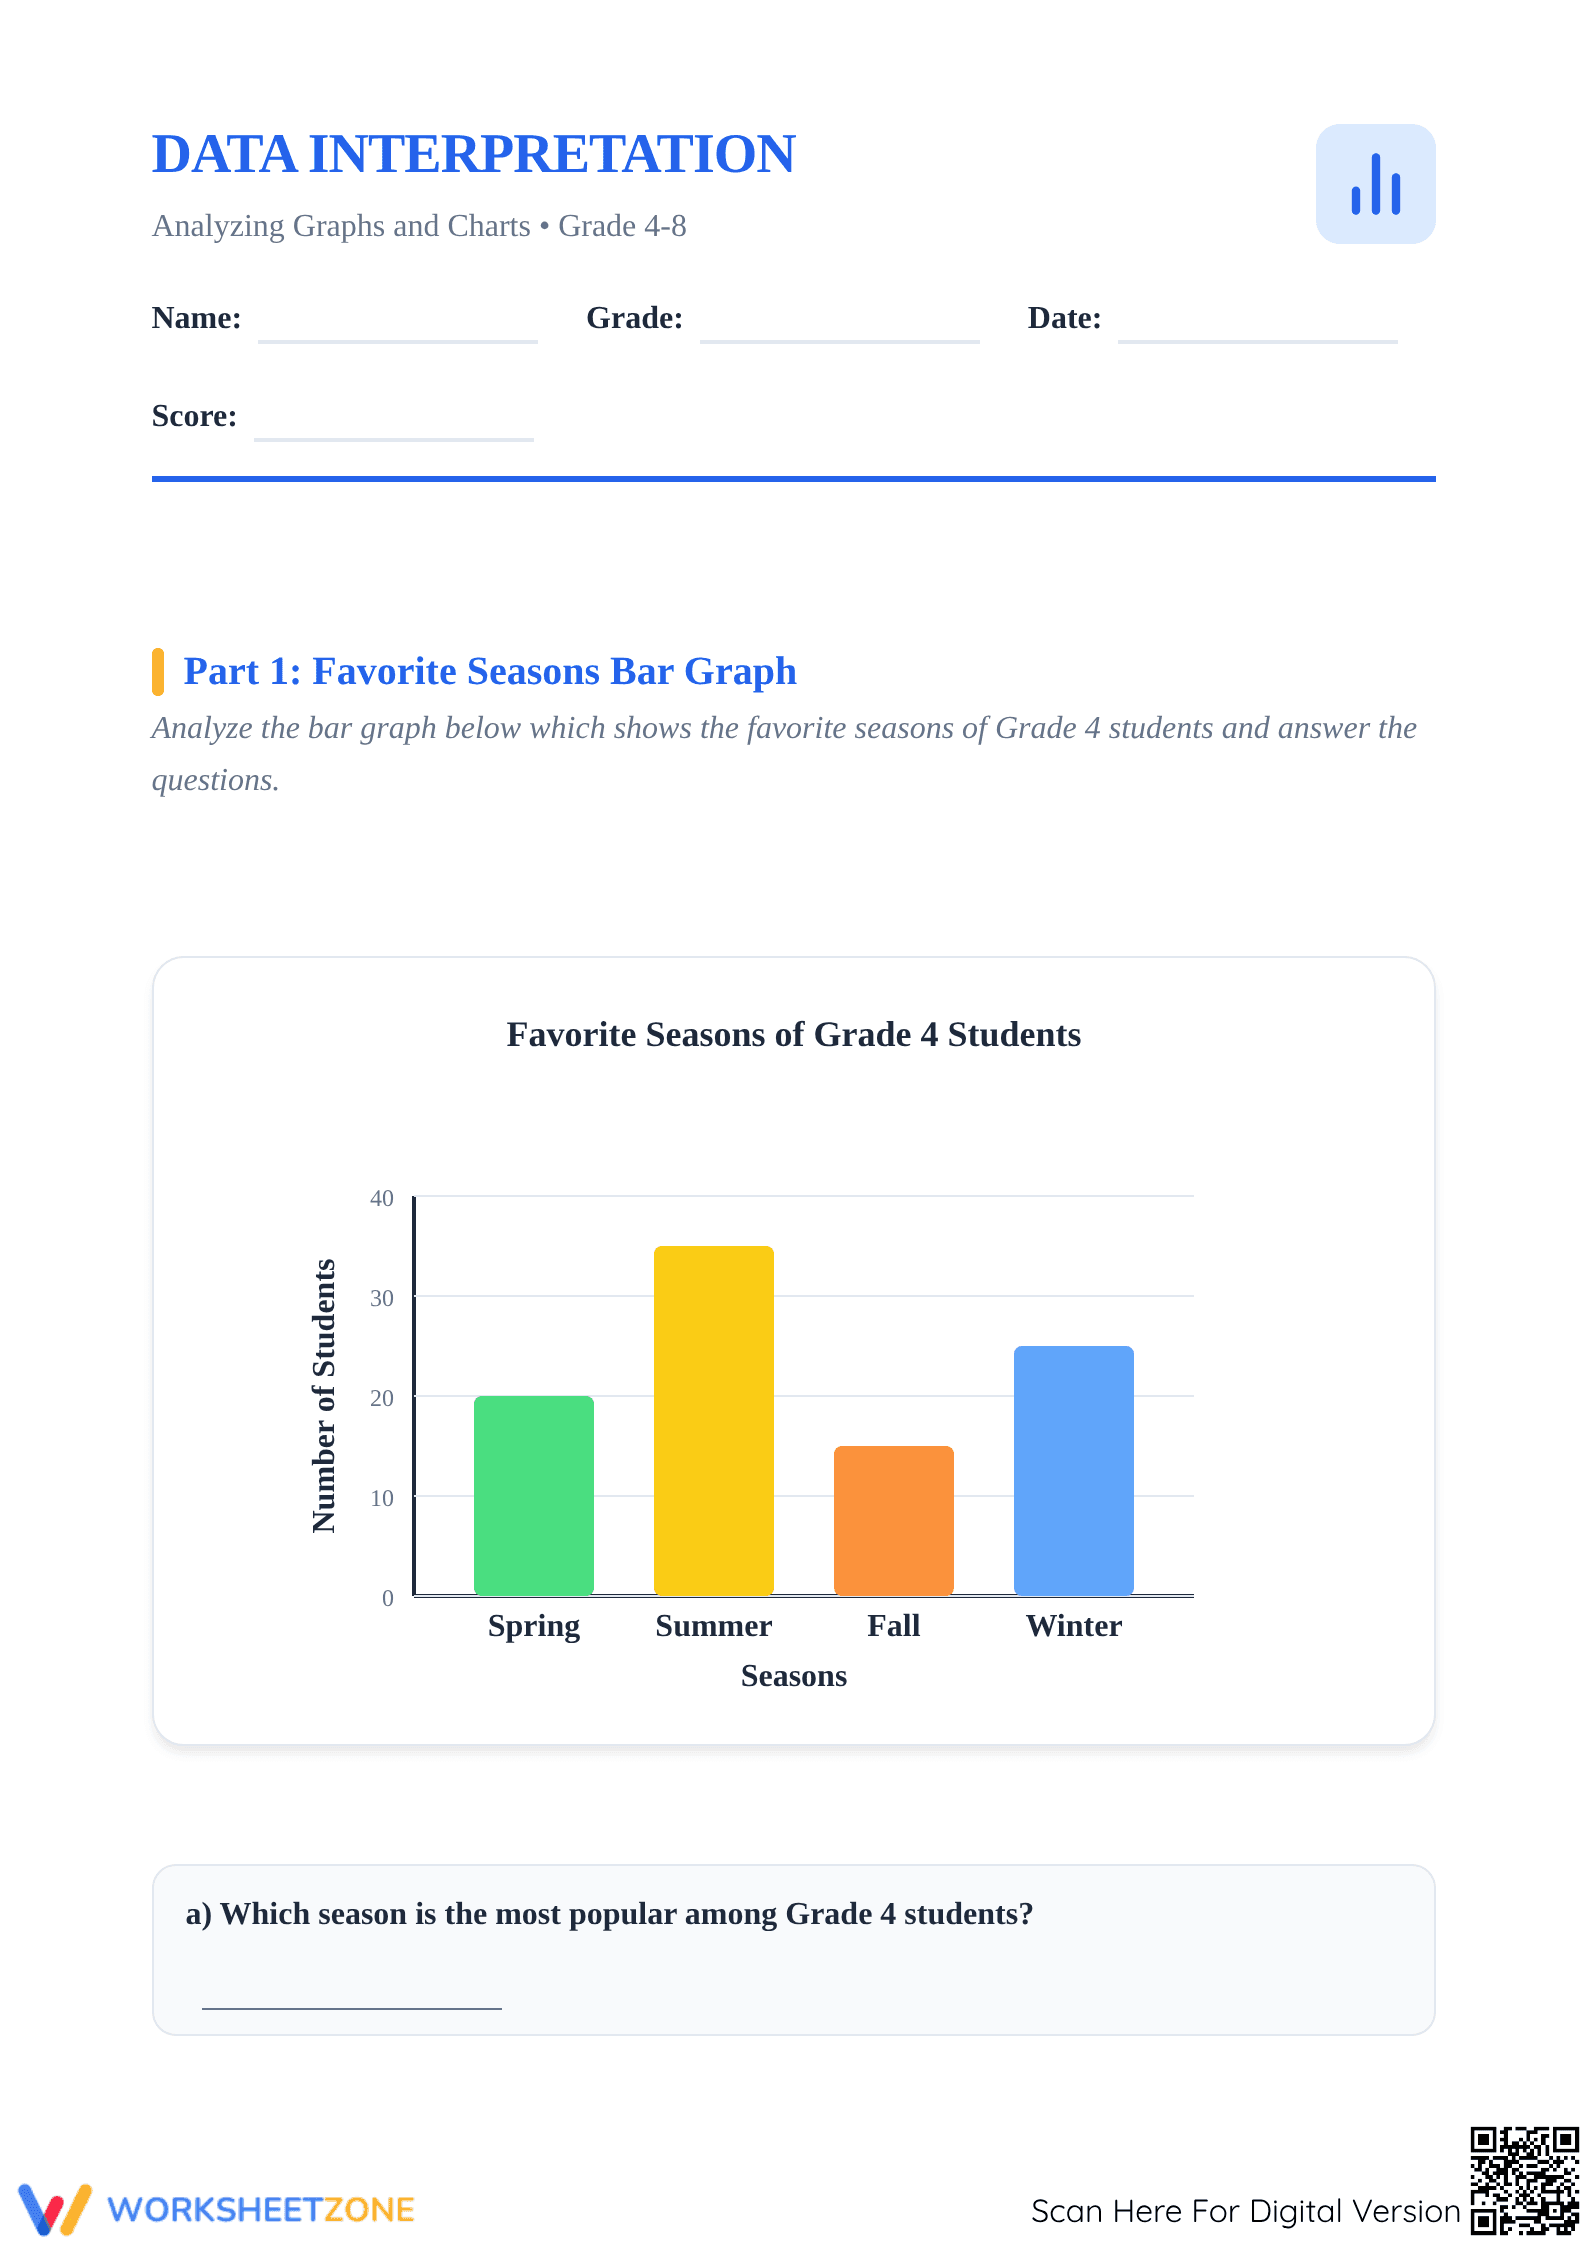
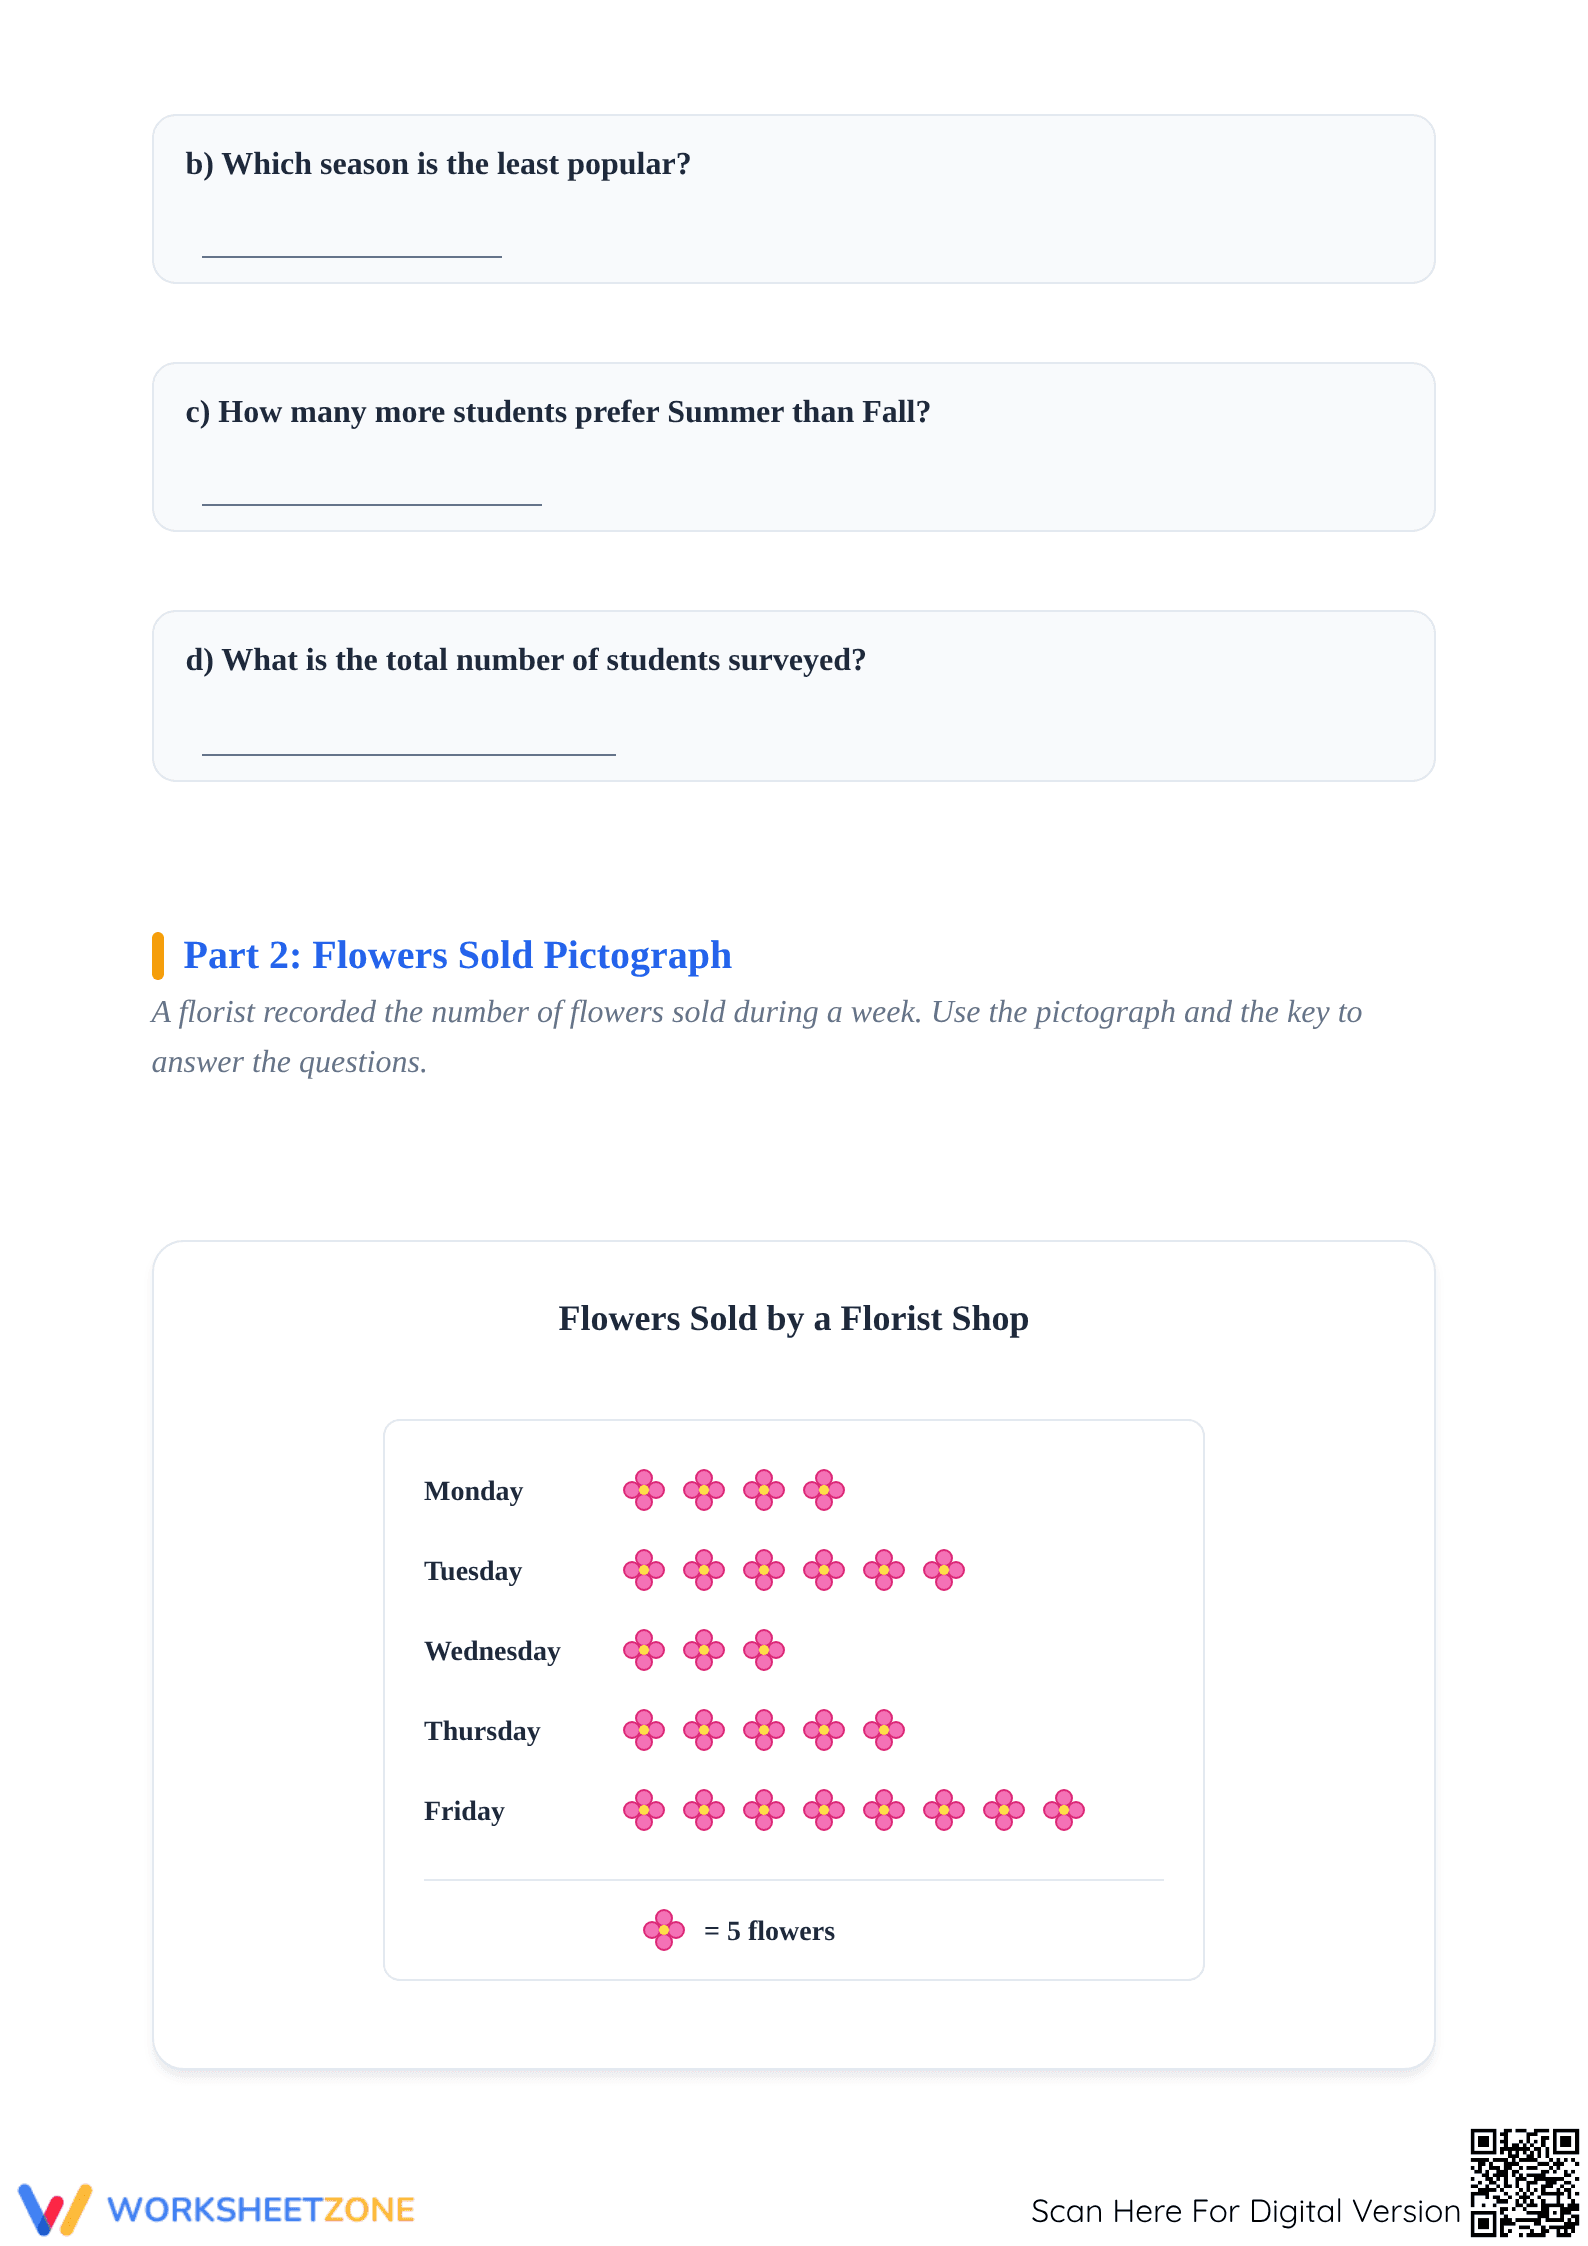
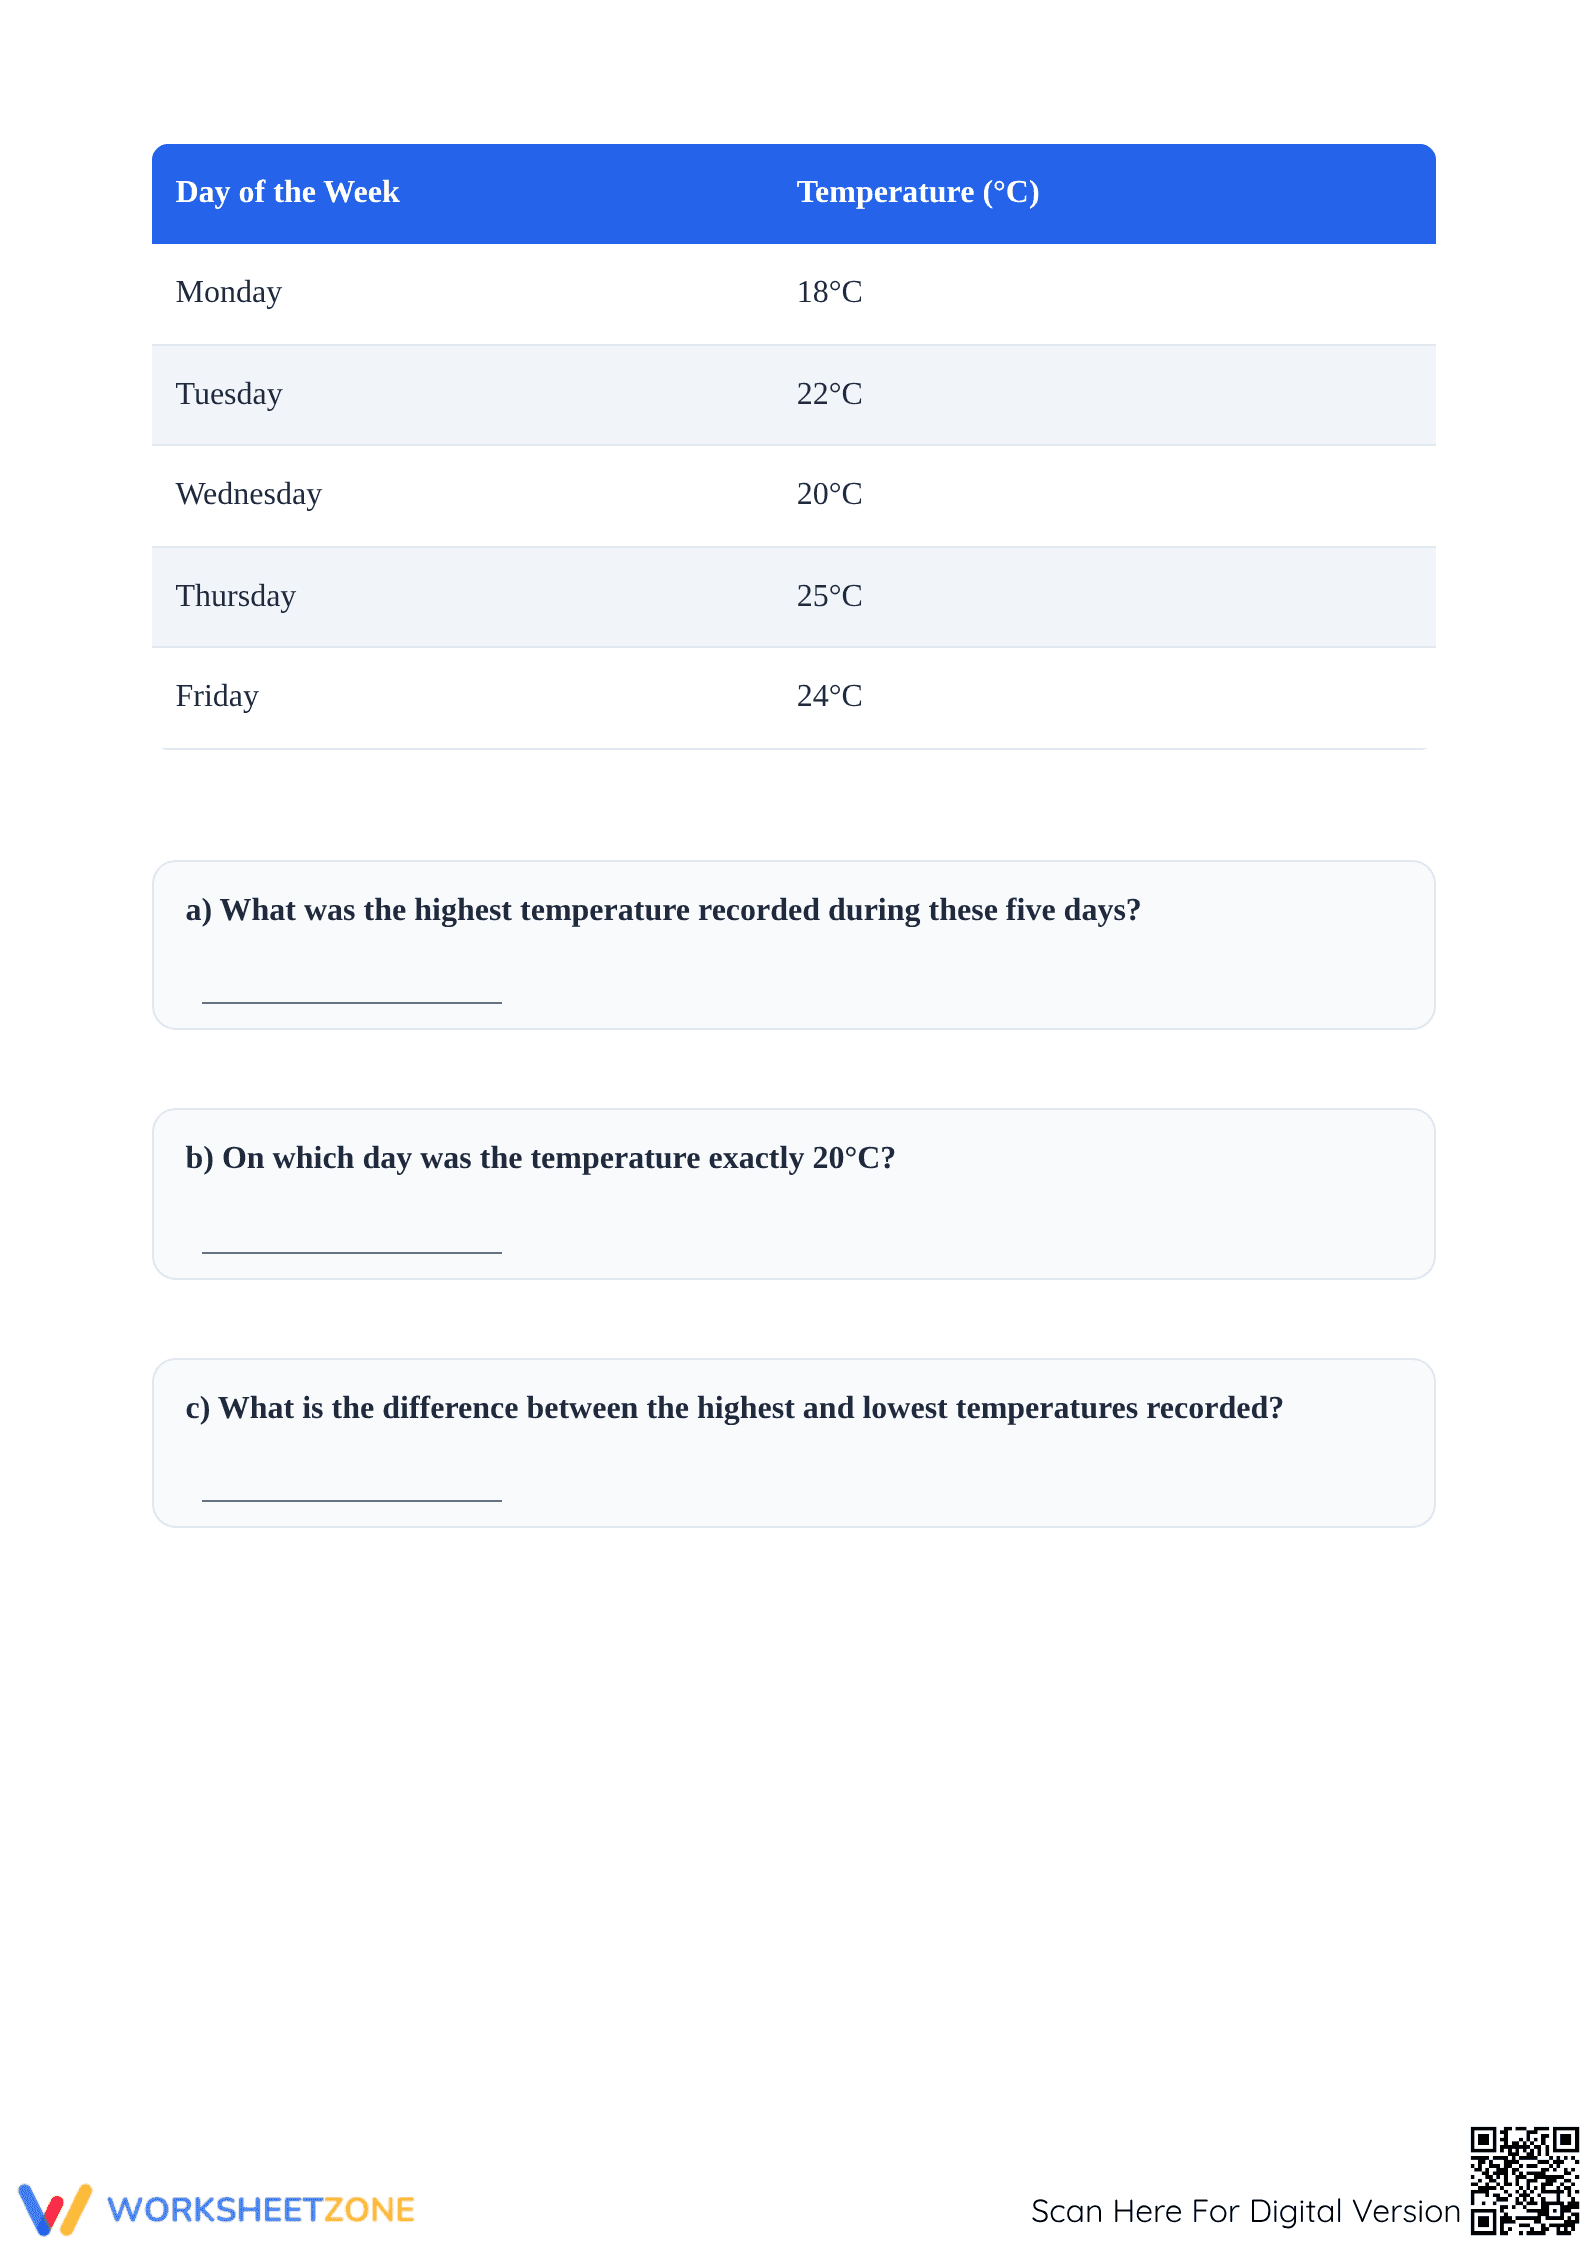
This 4-page PDF contains three dedicated sections focusing on different data formats. Part 1 features a vertical bar graph regarding favorite seasons. Part 2 presents a pictograph of flowers sold, requiring students to apply a 1:5 scale key. Part 3 utilizes a frequency table showing weekly temperatures. A complete answer key is provided for immediate grading.
Zero-Prep Workflow
Preparing this activity is remarkably efficient for busy educators. First, print the 4-page packet for your class, which takes only seconds. Next, distribute the worksheets and briefly review the pictograph key to ensure all students understand the scaled symbols. Finally, allow students to work independently, then use the answer key for rapid whole-class review. Total teacher prep time is under 2 minutes.
Standards Alignment
This resource is centered on CCSS.MATH.CONTENT.3.MD.B.3, which requires students to draw and interpret scaled picture graphs and bar graphs to represent data sets. It also supports CCSS.MATH.CONTENT.4.MD.B.4 by emphasizing the analysis of data to solve addition and subtraction problems. Both standard codes can be copied directly into lesson plans, IEP goals, or district curriculum mapping tools.
How to Use It
Deploy this worksheet as a summative assessment following a unit on data representation to gauge mastery. During the session, observe if students correctly apply the pictograph key of 5 flowers per symbol, as this is a common point of error. The expected completion time is approximately 30 minutes, making it an ideal "print and go" sub plan or homework assignment.
Who It's For
This packet is designed for upper elementary and middle school students in grades 4 through 8 who are refining their statistical reasoning. It provides excellent remediation for older students struggling with scale or enrichment for younger learners. Pair this resource with a blank graph paper task where students collect and graph their own classroom data.
Data interpretation is a foundational pillar of mathematical literacy that bridges the gap between basic arithmetic and advanced statistical analysis. According to Fisher & Frey (2014), the use of diverse visual representations—such as the bar graphs, pictographs, and tables included in this resource—is critical for developing a student's ability to transition from concrete observations to abstract reasoning. This worksheet targets CCSS.MATH.CONTENT.3.MD.B.3 by challenging students to perform complex "how many more" and "total number" calculations based on scaled data sets. The structured 12-problem layout ensures that learners encounter multiple formats within a single instructional session, reinforcing the versatility of data communication. Research indicates that frequent exposure to varied graphical formats improves a student's ability to identify trends and anomalies in larger, more complex data sets later in their academic careers. This resource provides the rigorous, standards-aligned practice necessary for achieving these long-term learning outcomes in STEM education.