These 6th grade data worksheets pdf resources cover the full arc of middle school statistics — from reading dot plots and histograms to interpreting box plots, computing measures of center, and explaining what those numbers reveal about a data set. Grade 6 is the first year students are expected to treat both center and spread as meaningful features of a distribution, not just numbers to calculate. Each worksheet in the set holds students to that standard: find the value, then say what it means.
What Students Practice Across the Set
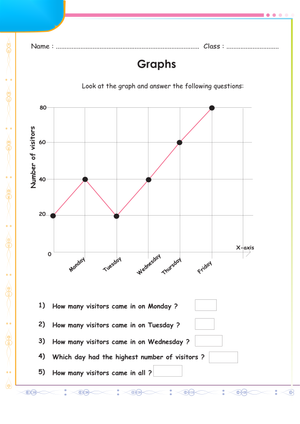
Graph reading is the entry point. Students identify titles, labels, and intervals; locate exact values; and pull specific data points from tables, dot plots, and histograms. This sounds foundational, but histogram bars trip students up more than teachers expect — reading frequency counts rather than individual values is genuinely tricky and worth practicing separately before asking students to interpret distributions.
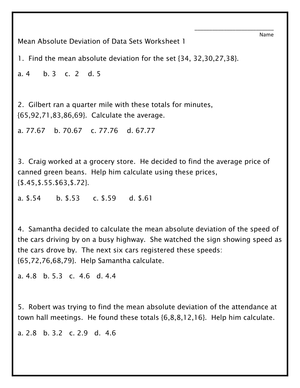
Numerical summaries make up the second major strand. Students compute mean, median, mode, and range, and the stronger worksheets push past computation by asking students to compare measures or explain which one best represents a particular data set. Some worksheets also bring in quartiles and interquartile range, which students encounter when they begin working with box plots.
Comparison tasks are where the reasoning deepens. Students look at two dot plots or two box plots side by side and determine which group has the higher median, the greater spread, or a more symmetric distribution. These questions require students to connect visual reading to statistical reasoning — exactly the kind of item that shows up on unit assessments and state tests.
Mistakes Students Make That These Worksheets Help You Catch
The most common median error is predictable: students find the middle number from the data as it appears on the worksheet, without sorting it first. A student who sees the list 12, 7, 19, 4, 11 and circles 19 because it's the third item has revealed something specific — they understand "middle position" but not that the data must be ordered before that position matters. This error is invisible when students only report a final answer; these worksheets require shown work, so the mistake surfaces on the first attempt rather than on the test.
Histogram misreading is subtler and more persistent. Students treat a bar with a height of 6 at the interval 40–50 as meaning six scores all equal to 40, rather than six scores spread across that range. They're reading frequency as a value label. A worksheet question that asks "how many students scored between 40 and 50?" catches this confusion directly — and the answer key gives teachers language for addressing it during review.
Box plots produce a third category of misreading. Students consistently assume the longest whisker contains the most data. In practice, each section of a box plot — the two whiskers and the two halves of the box — represents roughly the same 25 percent of the data regardless of visual length. Comparison tasks where students identify the more variable data set push this misconception into the open. Whole-class instruction alone rarely does.
A quieter computational error appears during mean practice. Students divide the sum by the count of distinct values rather than the total count of data points. In the list 3, 3, 5, 7, 9, a student may divide the sum by 4 rather than 5. It's worth watching for this explicitly on the first few computation worksheets before moving to interpretation work.
How to Fit These Worksheets Into Your Instructional Week
The most effective pattern is pairing a brief whole-class model with immediate independent practice on the matching worksheet. Spend five to seven minutes with a projected graph — name the intervals, read one value aloud, discuss what the distribution suggests. Then release students to work independently. That sequence cuts the "I don't know where to start" paralysis that data displays often produce, especially with histograms and box plots early in the unit.
For station rotations, the set divides naturally by cognitive demand. One station focuses on reading and computing — students pull values from a table and calculate mean and median. A second station holds comparison tasks: two dot plots, a few targeted questions, a sentence prompt. A third can feature a box plot with a full interpretation question. Because each worksheet targets a specific skill, the teacher can position students at the right entry point and move through the room listening to reasoning rather than re-explaining the task.
These 6th grade data worksheets pdf files work well as Monday warm-ups after a weekend gap. A short dot plot or histogram with three or four questions brings statistical vocabulary back into play before the lesson moves forward. The same format serves as a 10-minute review the day before a quiz — not new content, just retrieval of skills students have already worked with. For substitute plans, each worksheet provides a clear structure that produces student work the returning teacher can scan as a quick formative check.
Standard Alignment
These worksheets align to the CCSS 6.SP (Statistics and Probability) domain. Graph-reading and display tasks address 6.SP.B.4, which requires students to display and read numerical data in dot plots, histograms, and box plots. The measures-of-center work addresses 6.SP.A.3 and 6.SP.B.5c, asking students to calculate and interpret mean and median in context. Comparison tasks — particularly those involving two box plots — connect to 6.SP.B.5d, where students relate the choice of summary measure to the shape and real-world meaning of the distribution. In classroom terms, these worksheets fit the second half of a Grade 6 statistics unit, once students have been introduced to each display type and are ready for sustained independent practice across representations.
Adjusting the Set for a Range of Learners
For students still shaky on graph basics, reduce the data set and pre-label the scale. A dot plot with eight values is far more manageable than one with twenty, and students overwhelmed by visual complexity make errors that have nothing to do with their statistical understanding. A partially completed frequency table alongside a histogram gives those students a concrete bridge between the visual and the numerical without altering the underlying skill demand.
These 6th grade data worksheets pdf resources support extension without requiring additional materials. Ask students who finish early to write one sentence defending whether the mean or the median better represents the data set — and require them to cite specific numbers from the graph. That addition pushes students into the kind of statistical argument CCSS expects at Grade 6. Comparing two data sets and identifying which one shows greater variability is another reliable extension move that requires nothing beyond what's already on the worksheet.
Partner discussion during independent practice is worth building in across all levels. Students who explain their thinking aloud — pointing to the graph before they write — tend to catch their own errors and produce stronger written responses. A brief turn-and-talk before the written portion makes interpretation prompts more productive, especially for students who have the right reasoning but struggle to transfer it into writing.
Frequently Asked Questions
What graph types do these worksheets cover?
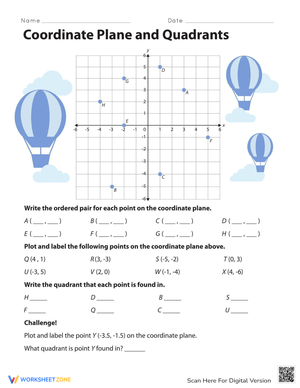
The set includes practice with tables, dot plots, histograms, and box plots — the four display types most central to 6th grade statistics. Some worksheets also incorporate coordinate graphs in data interpretation contexts.
Are answer keys included?
Yes. Each worksheet comes with a corresponding answer key. For interpretation questions, the key includes sample acceptable responses so teachers can evaluate written explanations without guessing at what counts as a complete answer.
How do these worksheets address mean, median, mode, and range?
Each measure receives dedicated practice, but the stronger worksheets don't stop at calculation. Students also explain what the median reveals about a typical value, or why the mean might not accurately represent a data set with an outlier. That combination — compute, then interpret — is where statistical thinking actually develops.
Can these worksheets support small-group intervention?
Yes. Because each worksheet targets a specific skill, they fit naturally into focused pull-out or small-group work. Teachers who keep a set of 6th grade data worksheets pdf resources organized by skill type can find the right starting point quickly — whether the gap is histogram reading, sorting before finding median, or understanding what the interquartile range actually measures. The focused format means students aren't confronted with unfamiliar task types mid-worksheet when the goal is reinforcing something specific.