


Views
Downloads
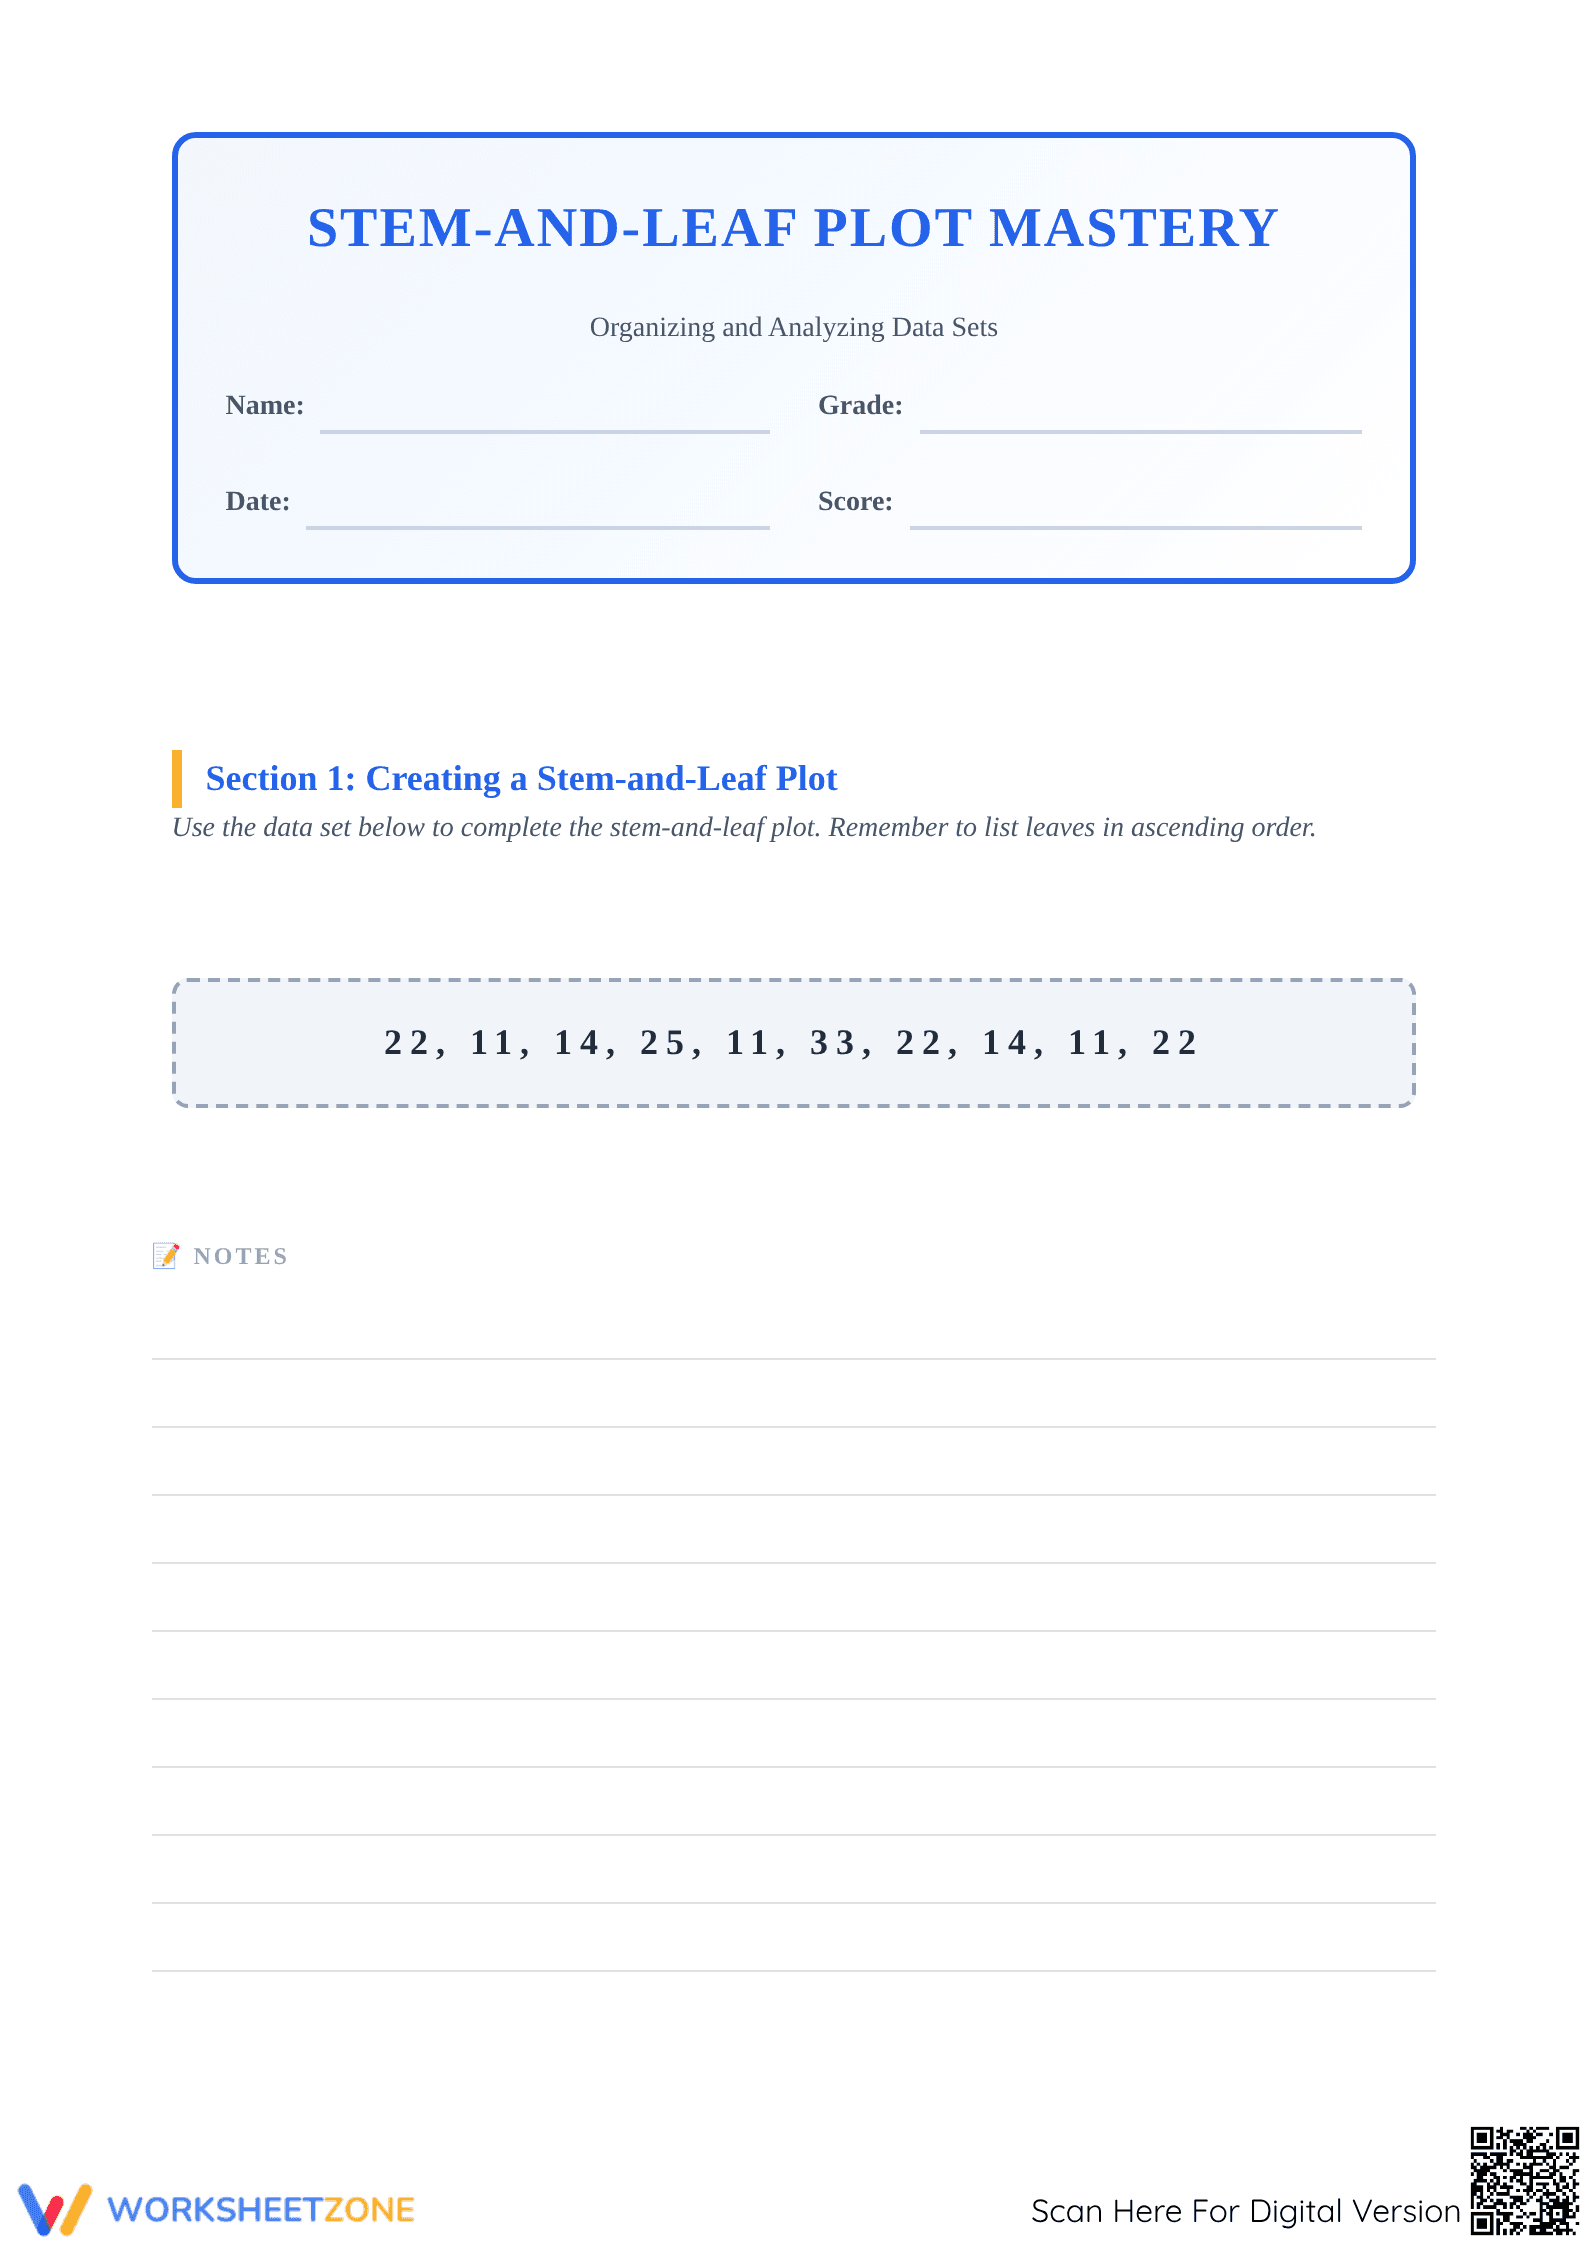
Printable Stem-and-Leaf Plot Mastery | Grade 6 Math
Paste this activity's link or code into your existing LMS (Google Classroom, Canvas, Teams, Schoology, Moodle, etc.).
Students can open and work on the activity right away, with no student login required.
You'll still be able to track student progress and results from your teacher account.
This comprehensive stem-and-leaf plot mastery worksheet helps middle school students organize and analyze numerical data sets with precision. By engaging with scenarios like temperature tracking and test score analysis, learners develop the essential ability to visualize distributions. This resource ensures students reach procedural fluency in data representation and interpretation.
At a Glance
- Grade: 6 · Subject: Math
- Standard:
6.SP.B.4— Display numerical data in plots, including stem-and-leaf and dot plots- Skill Focus: Stem-and-Leaf Plot Construction
- Format: 4 pages · 11 problems · Answer key included · PDF
- Best For: Middle school data analysis unit practice
- Time: 45–60 minutes
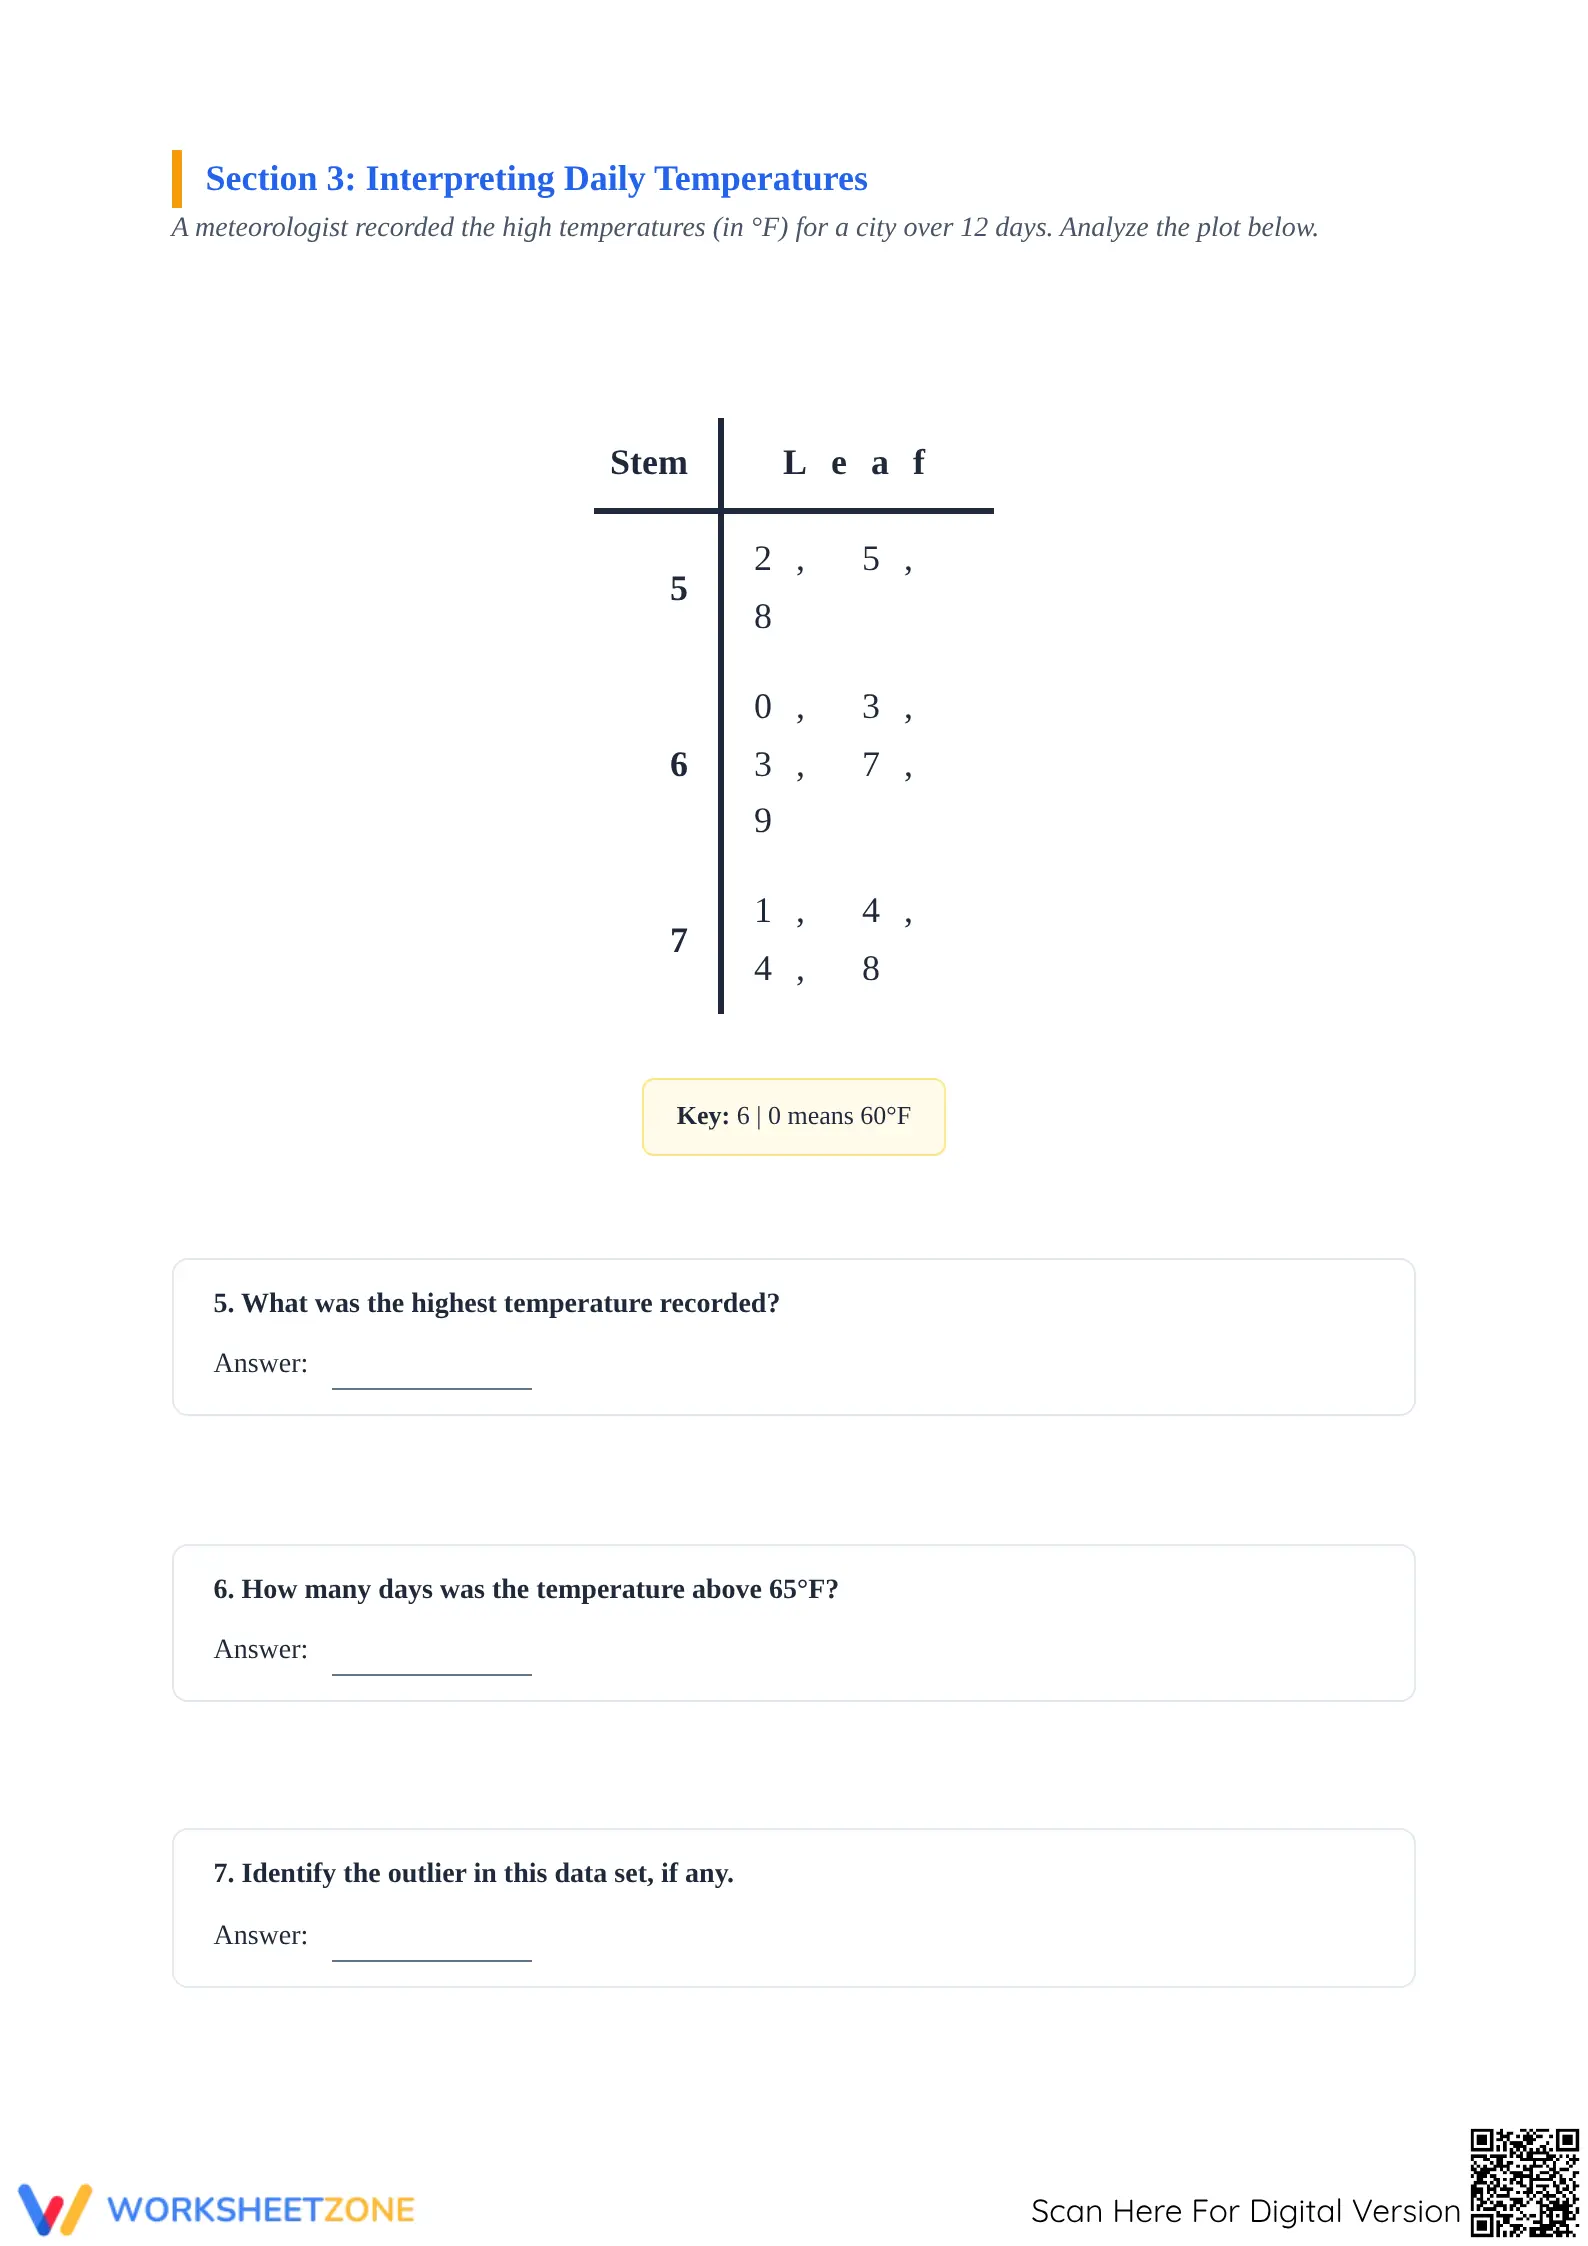
This 4-page instructional packet contains four distinct sections designed to build confidence. Students are guided through creating their own plots from raw data sets, interpreting existing plots for temperature data, and identifying outliers. The worksheet includes clear keys for interpretation (e.g., 6 | 0 means 60°F), dedicated space for calculations of mean, median, mode, and range, and a full answer key for immediate feedback.
Skill Progression
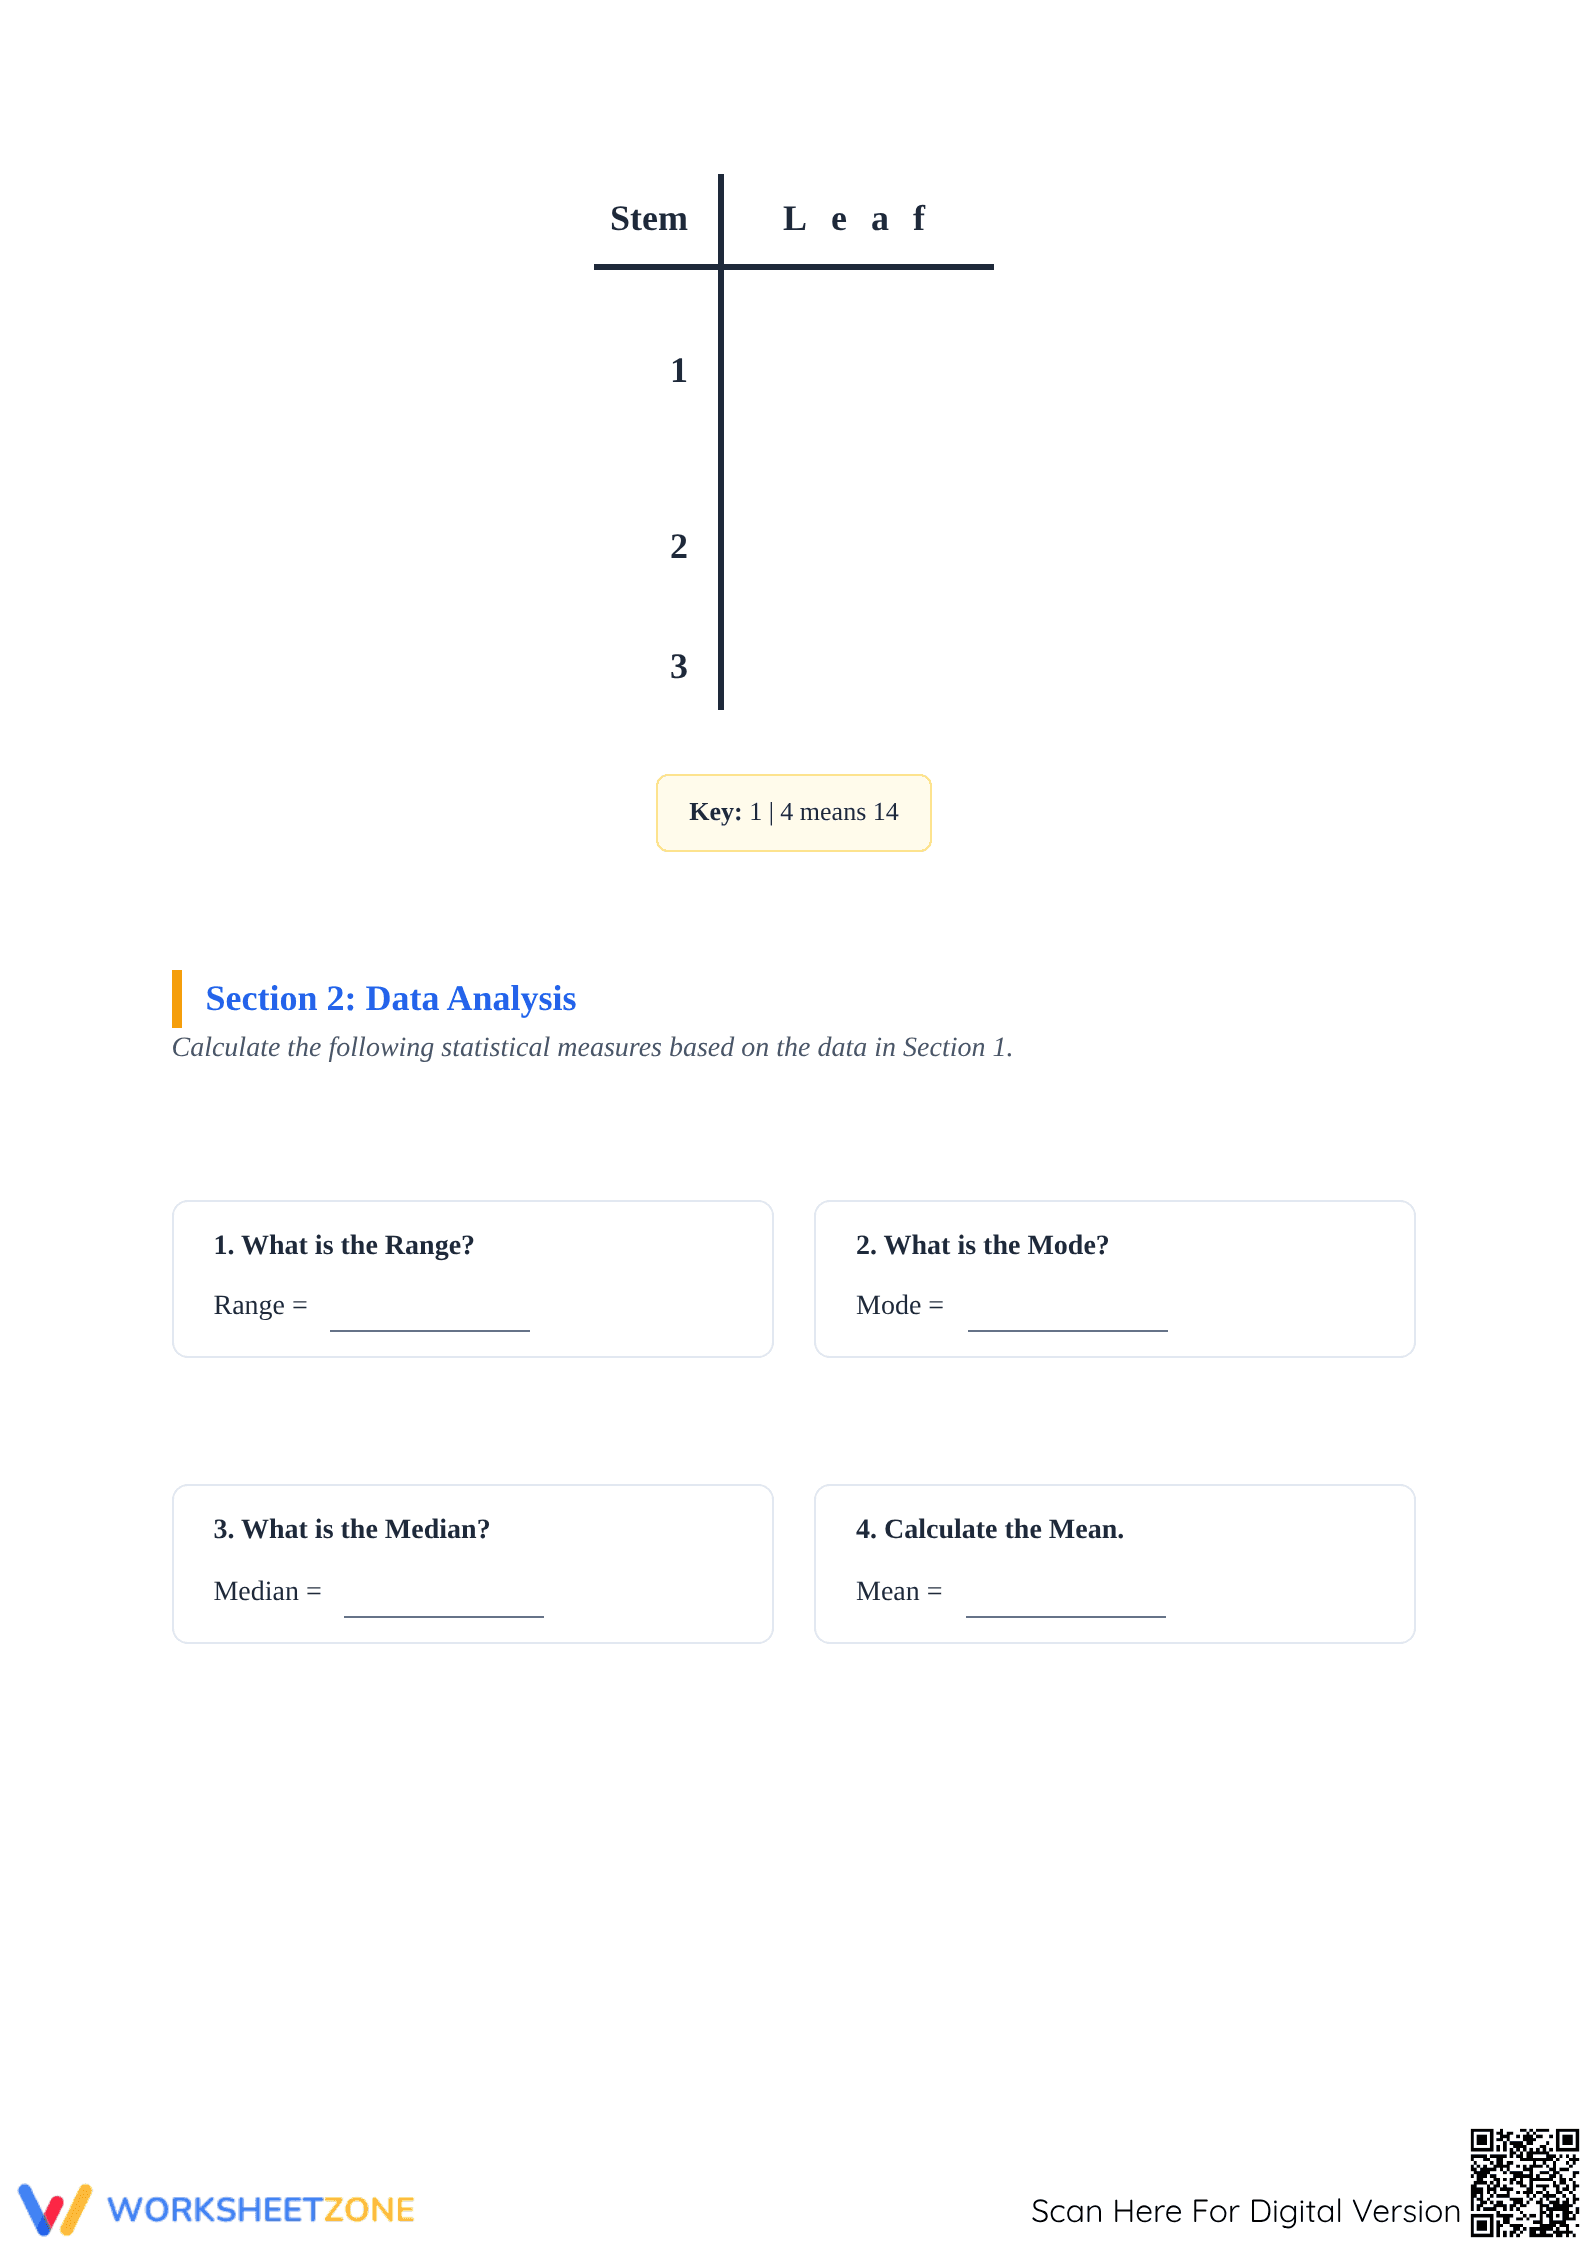
- Guided practice: The first section provides a raw data set and a pre-formatted stem-and-leaf table with 3 stems, allowing students to focus on correct leaf placement and ascending order.
- Supported practice: Section 3 shifts to interpretation, requiring students to extract specific data points, such as the highest value or frequency counts, from a completed plot.
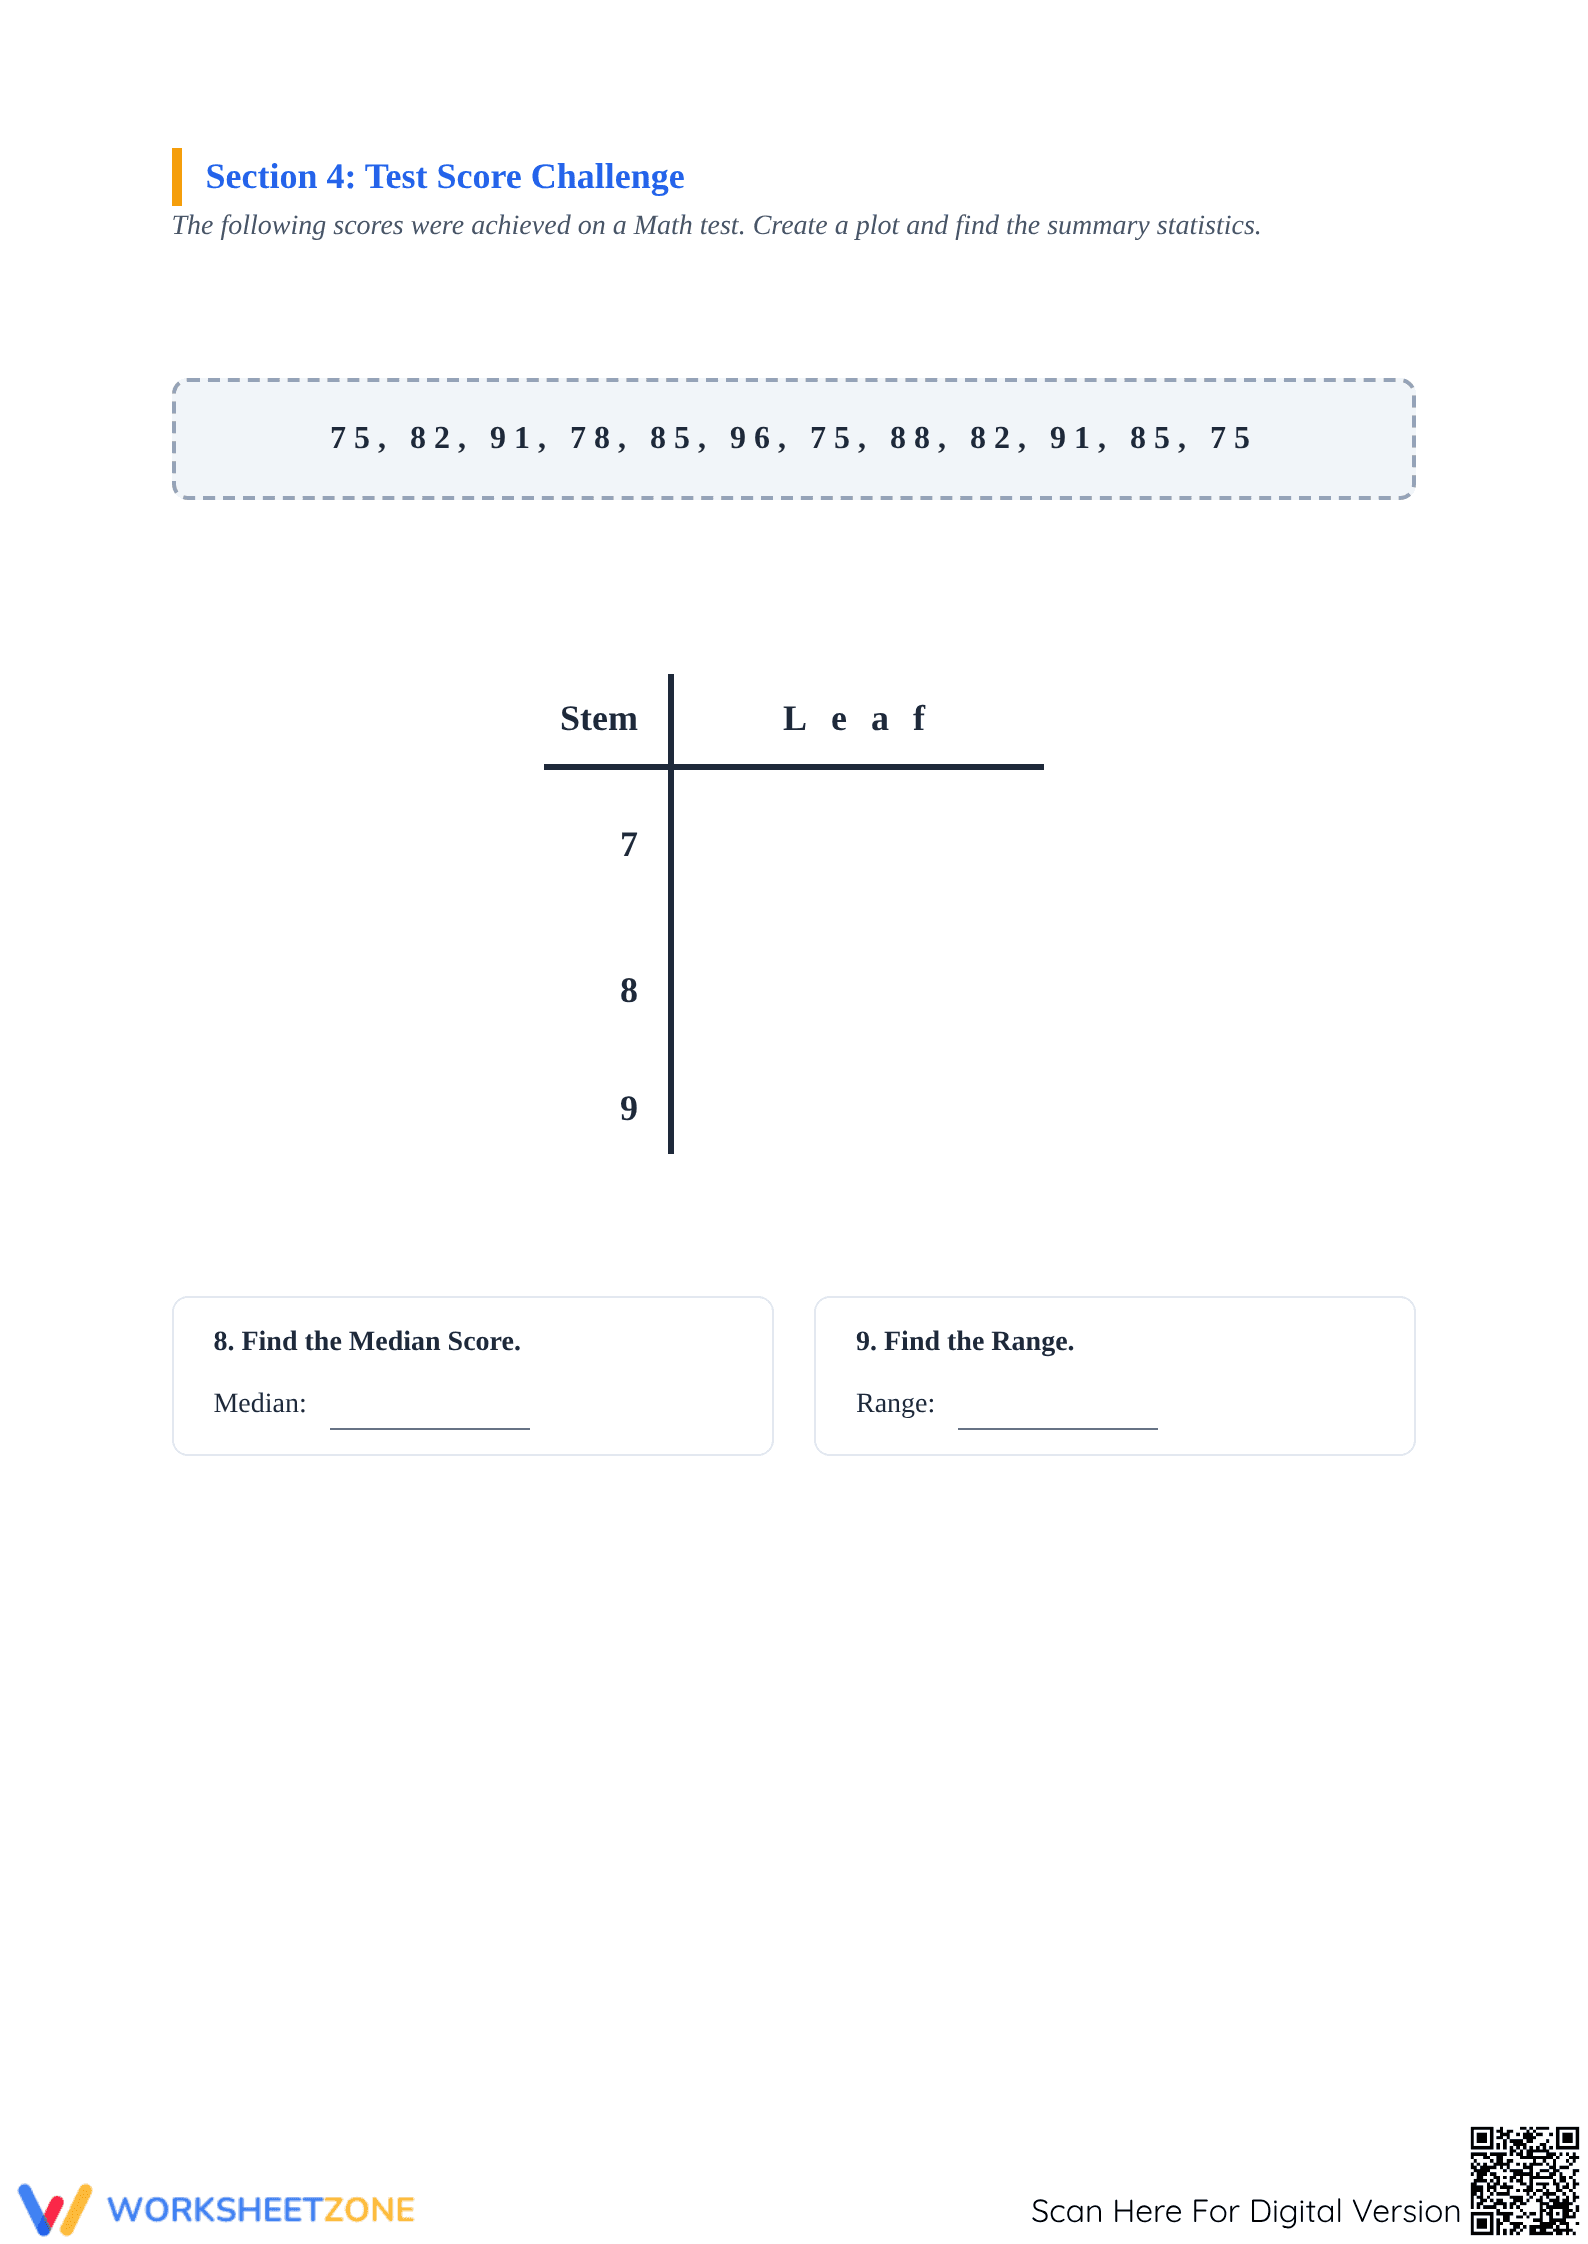
- Independent practice: The final challenge removes scaffolding, asking students to construct a full plot for test scores and calculate summary statistics independently to demonstrate mastery.
This progression follows the gradual-release model to move students from basic construction to high-level analysis.
Standards Alignment
This resource is primarily aligned with 6.SP.B.4, which requires students to display numerical data in plots on a number line. It also supports 6.SP.B.5 by asking students to summarize numerical data sets in relation to their context, such as identifying the center and spread. Both standard codes can be copied directly into lesson plans, IEP goals, or district curriculum mapping tools.
How to Use It
Use this worksheet as a summative assessment at the end of a data visualization unit or as a comprehensive sub plan that requires zero teacher preparation. During the activity, circulate and observe students to ensure they are listing leaves in ascending order—a common point of error. The expected completion time is approximately 50 minutes, making it perfect for a single class period.
Who It's For
This packet is designed for Grade 6 students but is highly effective for Grade 5 enrichment or Grade 7-8 intervention. It provides clear visual structures that benefit English Language Learners and students with processing needs. Pair this resource with a digital data display tool or a passage about meteorological data to create a cross-curricular learning experience.
Data visualization is a critical literacy skill that bridges the gap between raw information and insights. According to NAEP, students who can fluently transition between data sets and graphical representations like stem-and-leaf plots demonstrate higher levels of mathematical reasoning. This worksheet targets standard 6.SP.B.4 by providing 11 rigorous tasks that require students to organize numerical data and derive meaning. Research from NAEP suggests that consistent practice with diverse plot types improves long-term retention of data analysis concepts. By integrating construction and interpretation tasks, this resource ensures that students understand the underlying structure of the data they are manipulating. This approach aligns with best practices for middle school mathematics instruction, emphasizing the importance of visual models in developing a conceptual understanding of statistics.