


Views
Downloads
Printable Stem and Leaf Plots Worksheet | Grade 6 Math
Paste this activity's link or code into your existing LMS (Google Classroom, Canvas, Teams, Schoology, Moodle, etc.).
Students can open and work on the activity right away, with no student login required.
You'll still be able to track student progress and results from your teacher account.
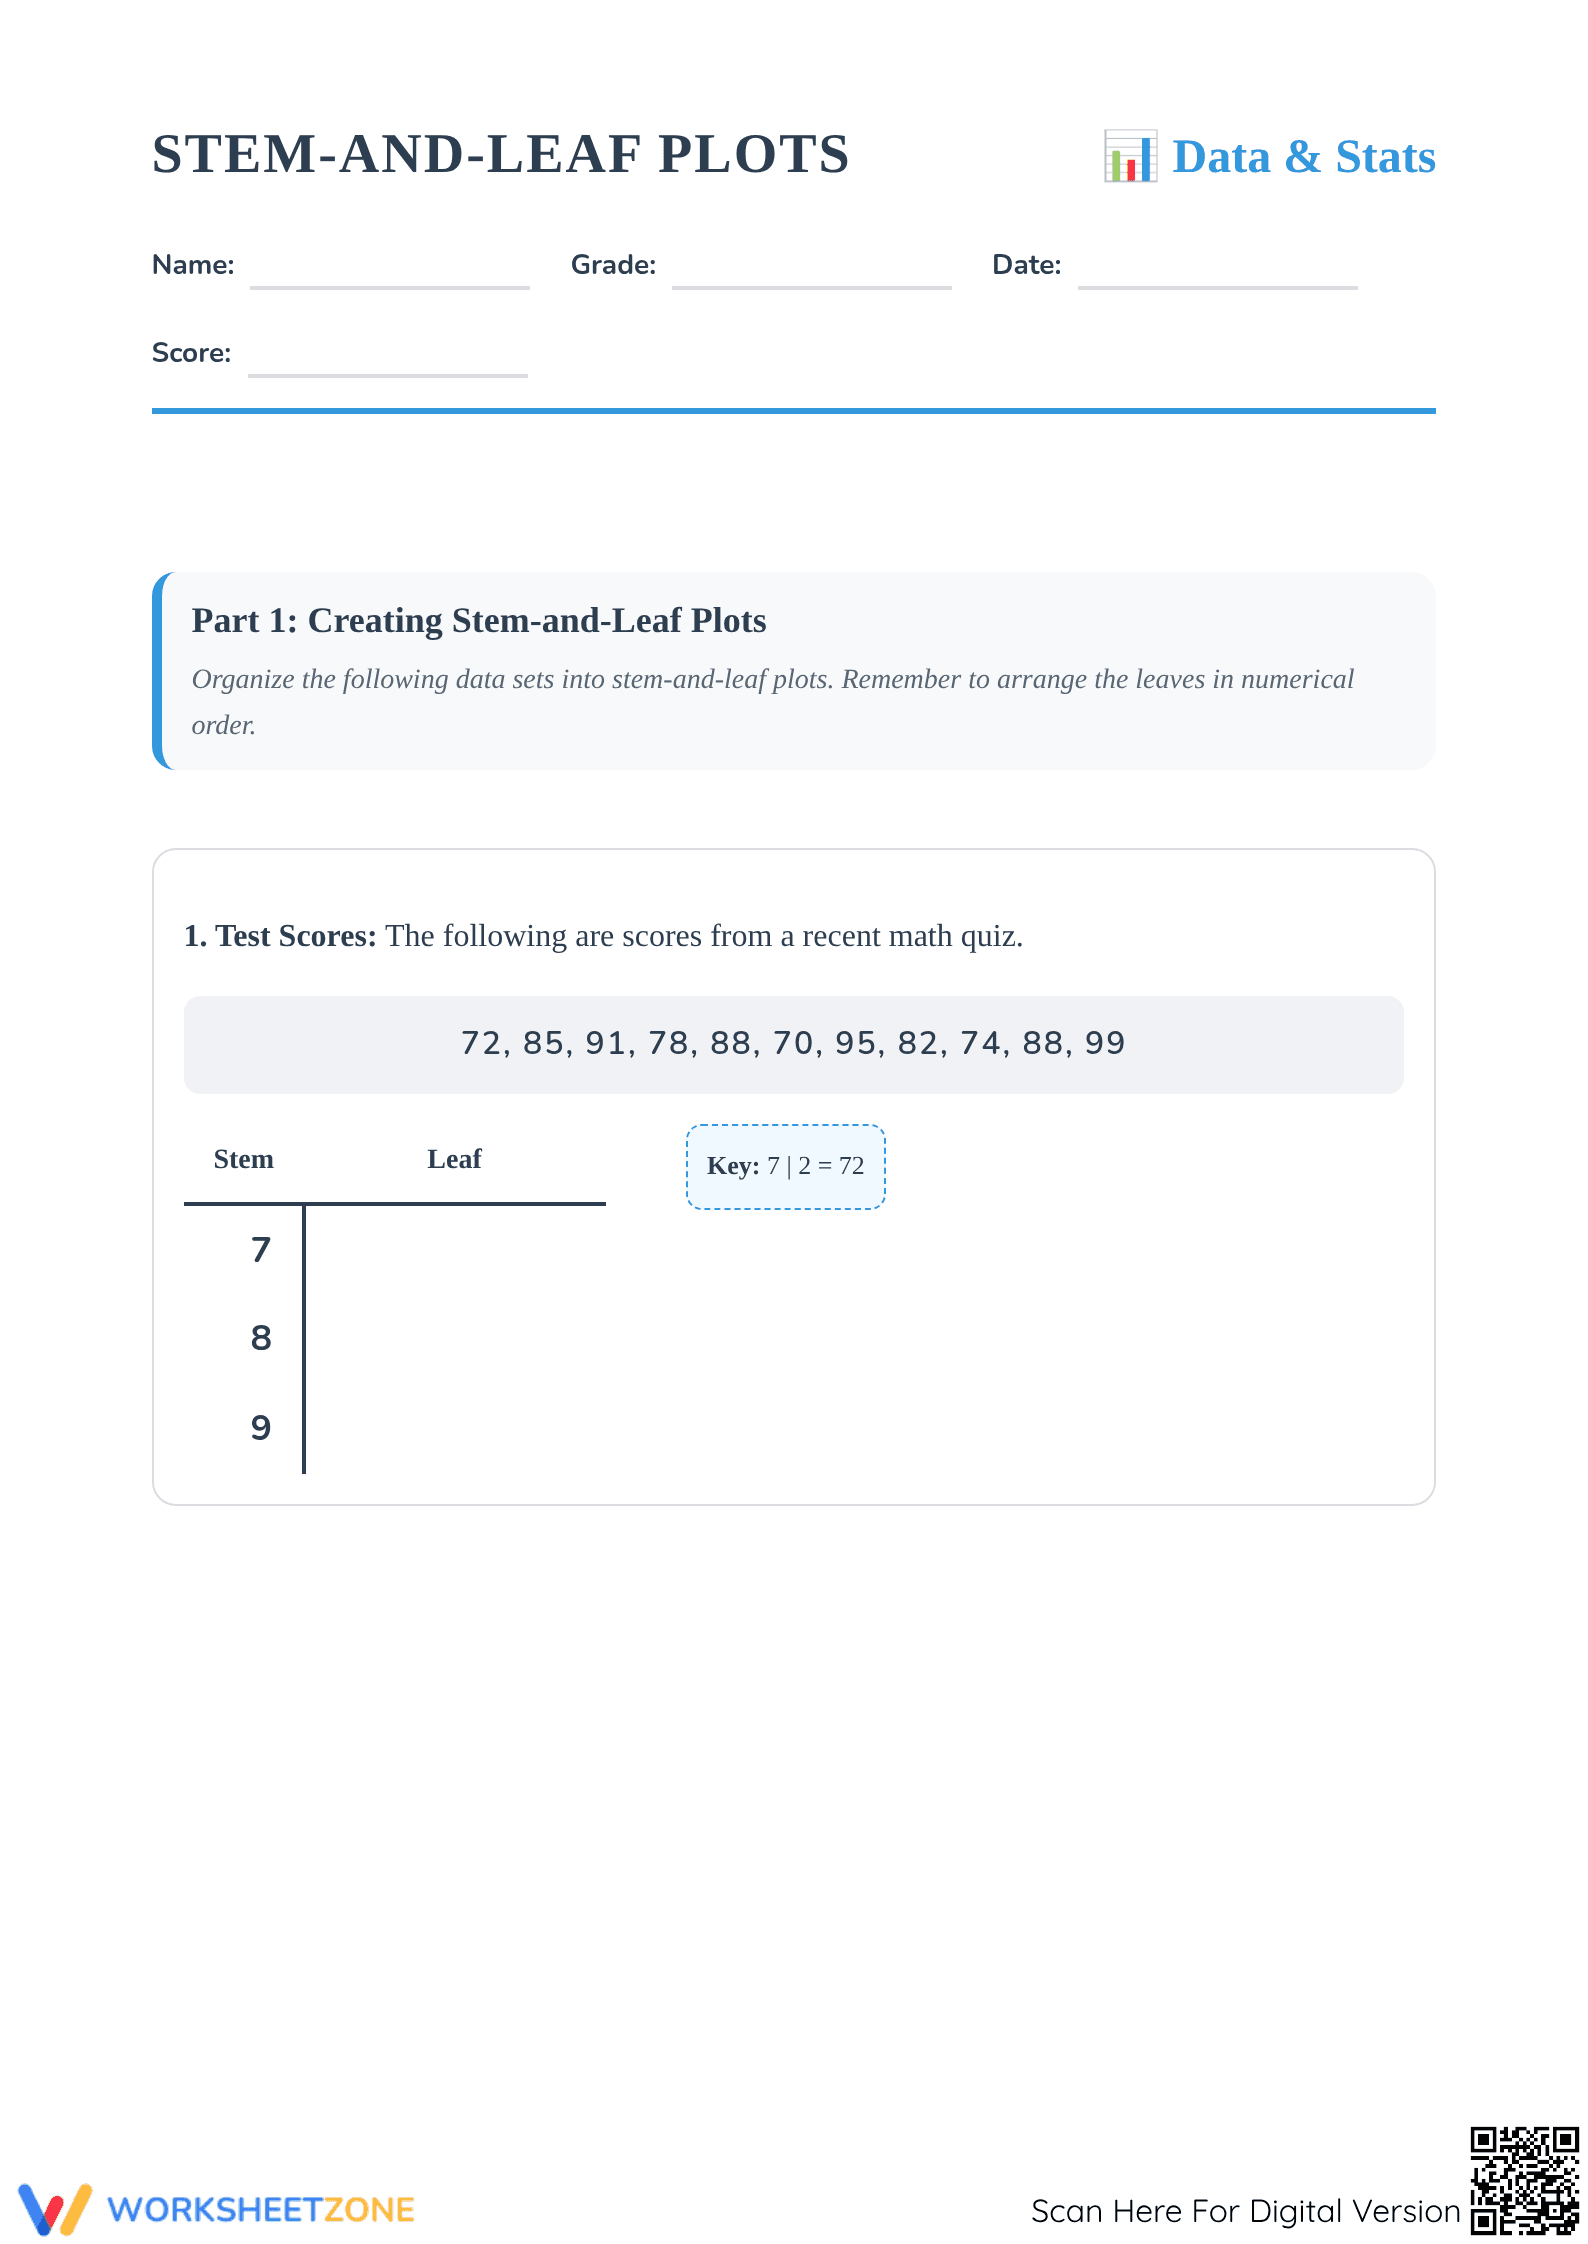
This comprehensive Stem and Leaf Plots worksheet guides students through the complete cycle of data organization and interpretation. Students move from creating plots using raw data to performing statistical analysis of existing sets, including finding the median, mode, and range. It is an essential resource for developing foundational statistical reasoning.
At a Glance
- Grade: 6 · Subject: Math
- Standard:
CCSS.MATH.CONTENT.6.SP.B.4— Display numerical data in plots, including dot plots and stem-and-leaf variations- Skill Focus: Data visualization and statistical analysis
- Format: 4 pages · 5 problems · Answer key included · PDF
- Best For: Middle school data and statistics units
- Time: 30–45 minutes
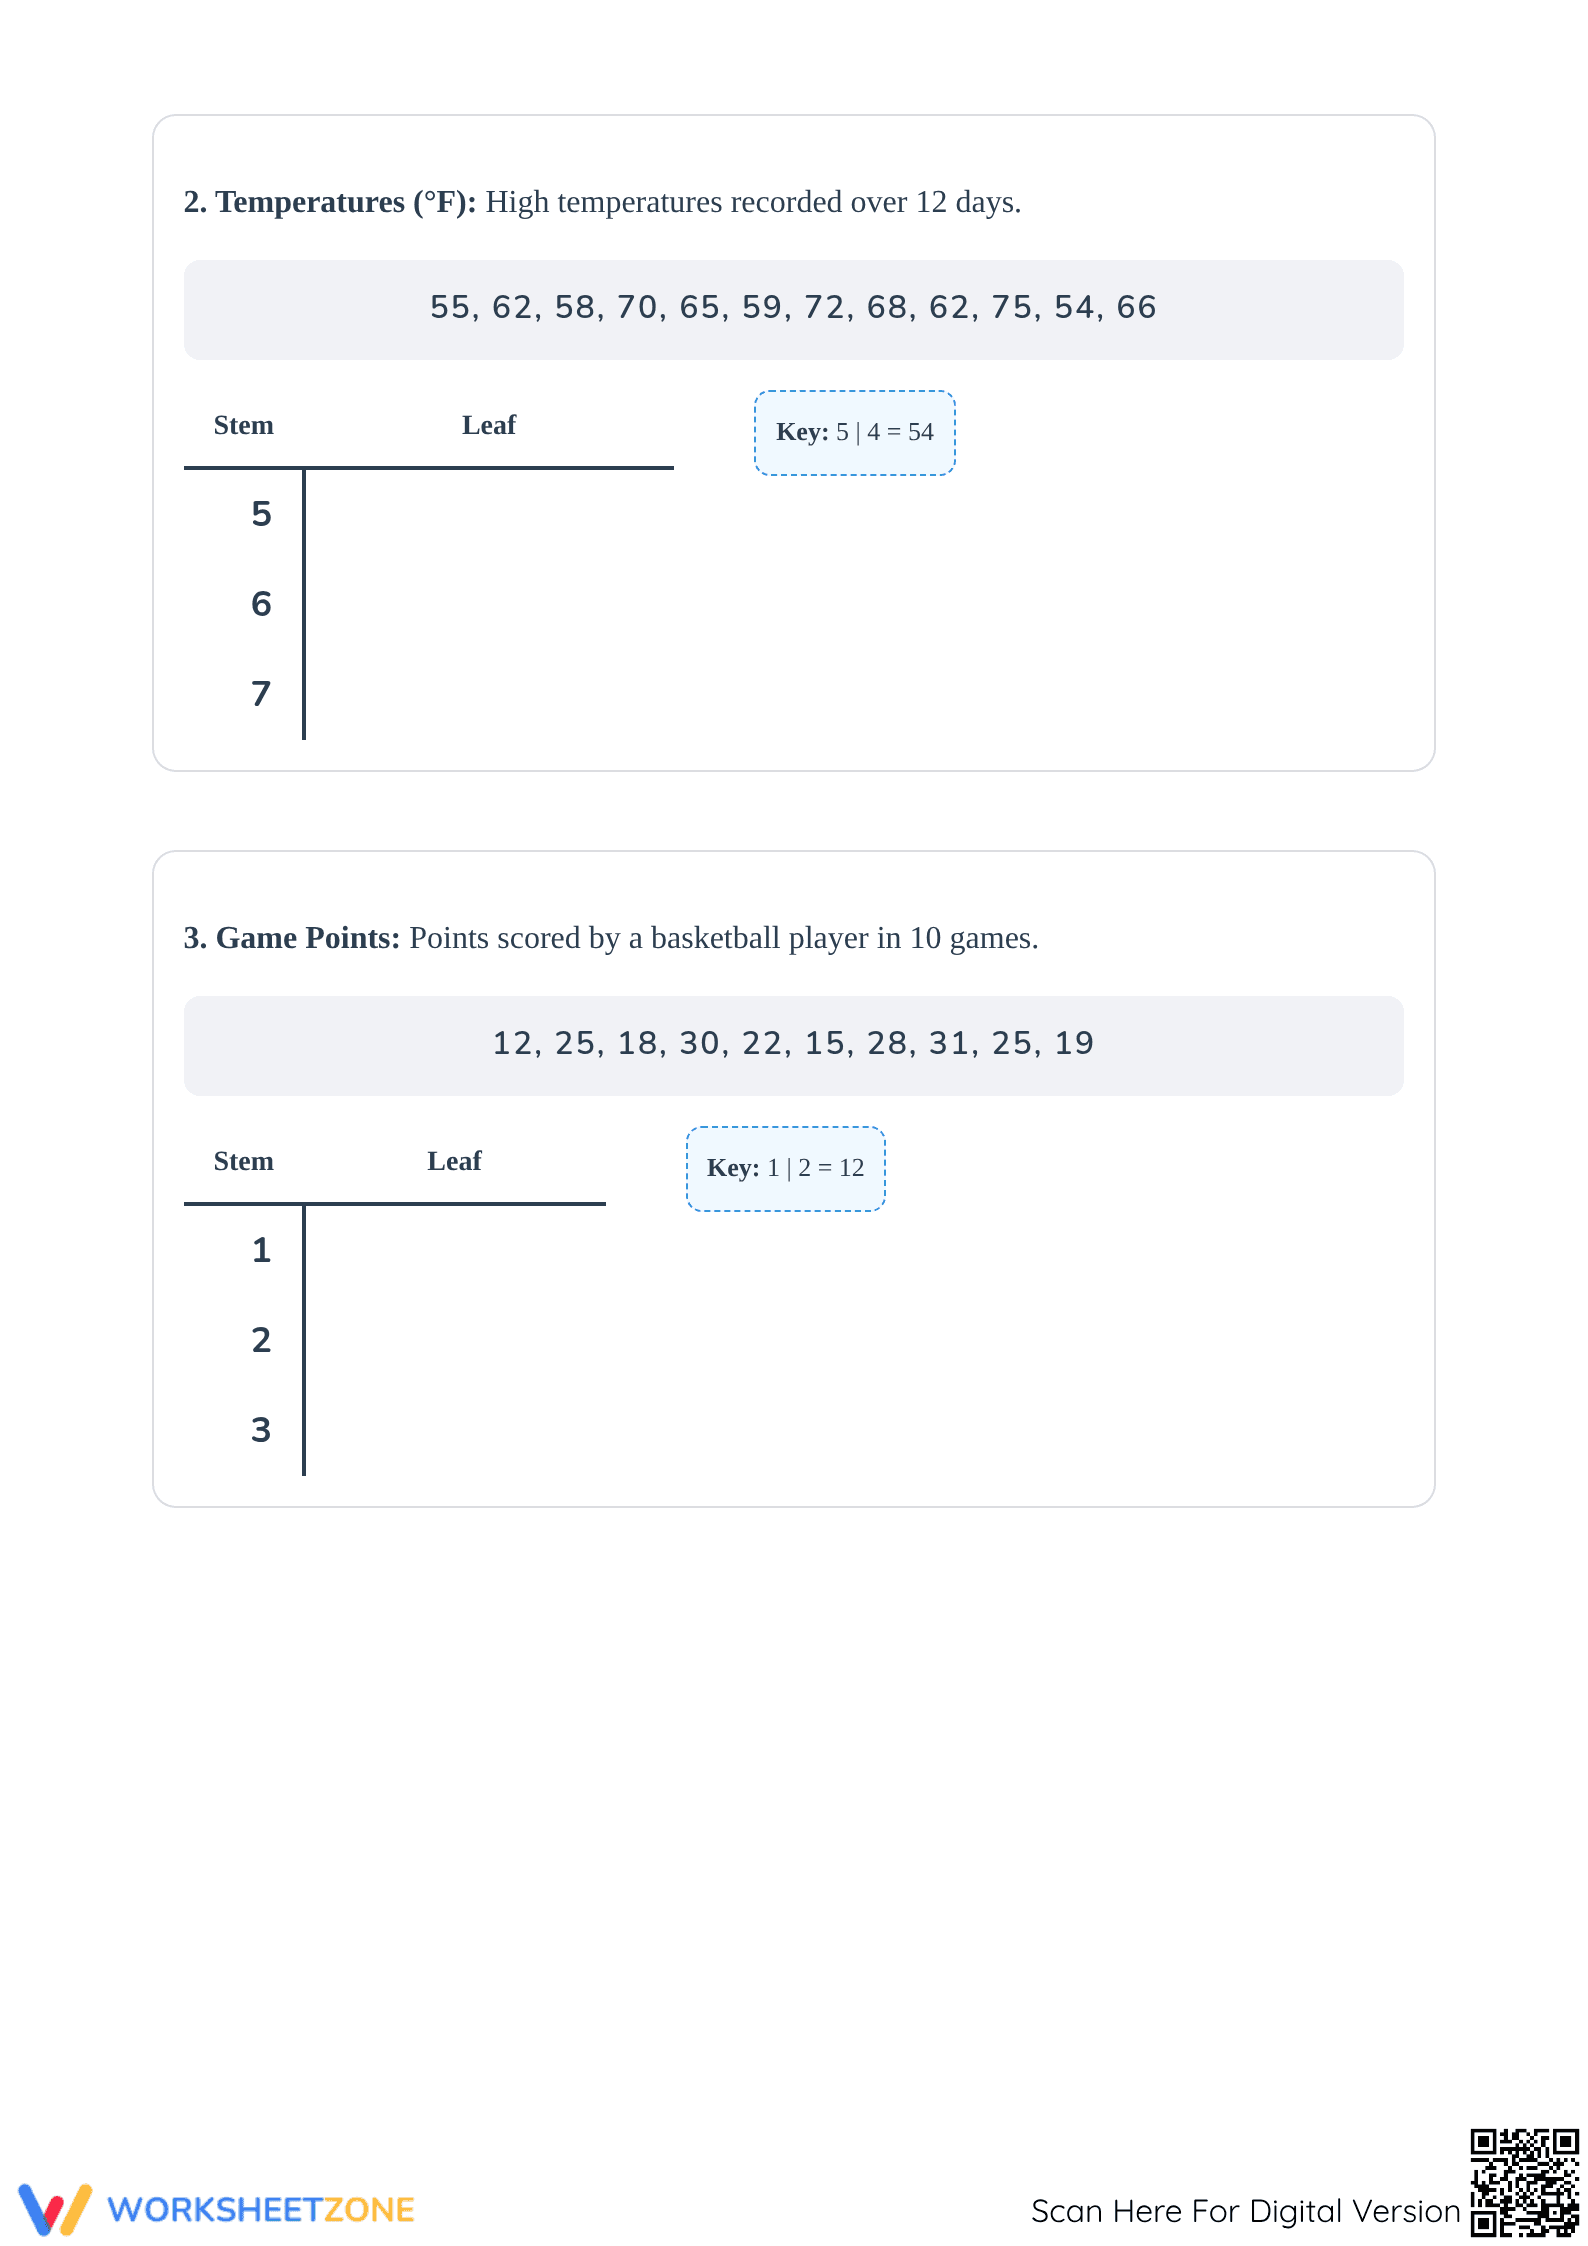
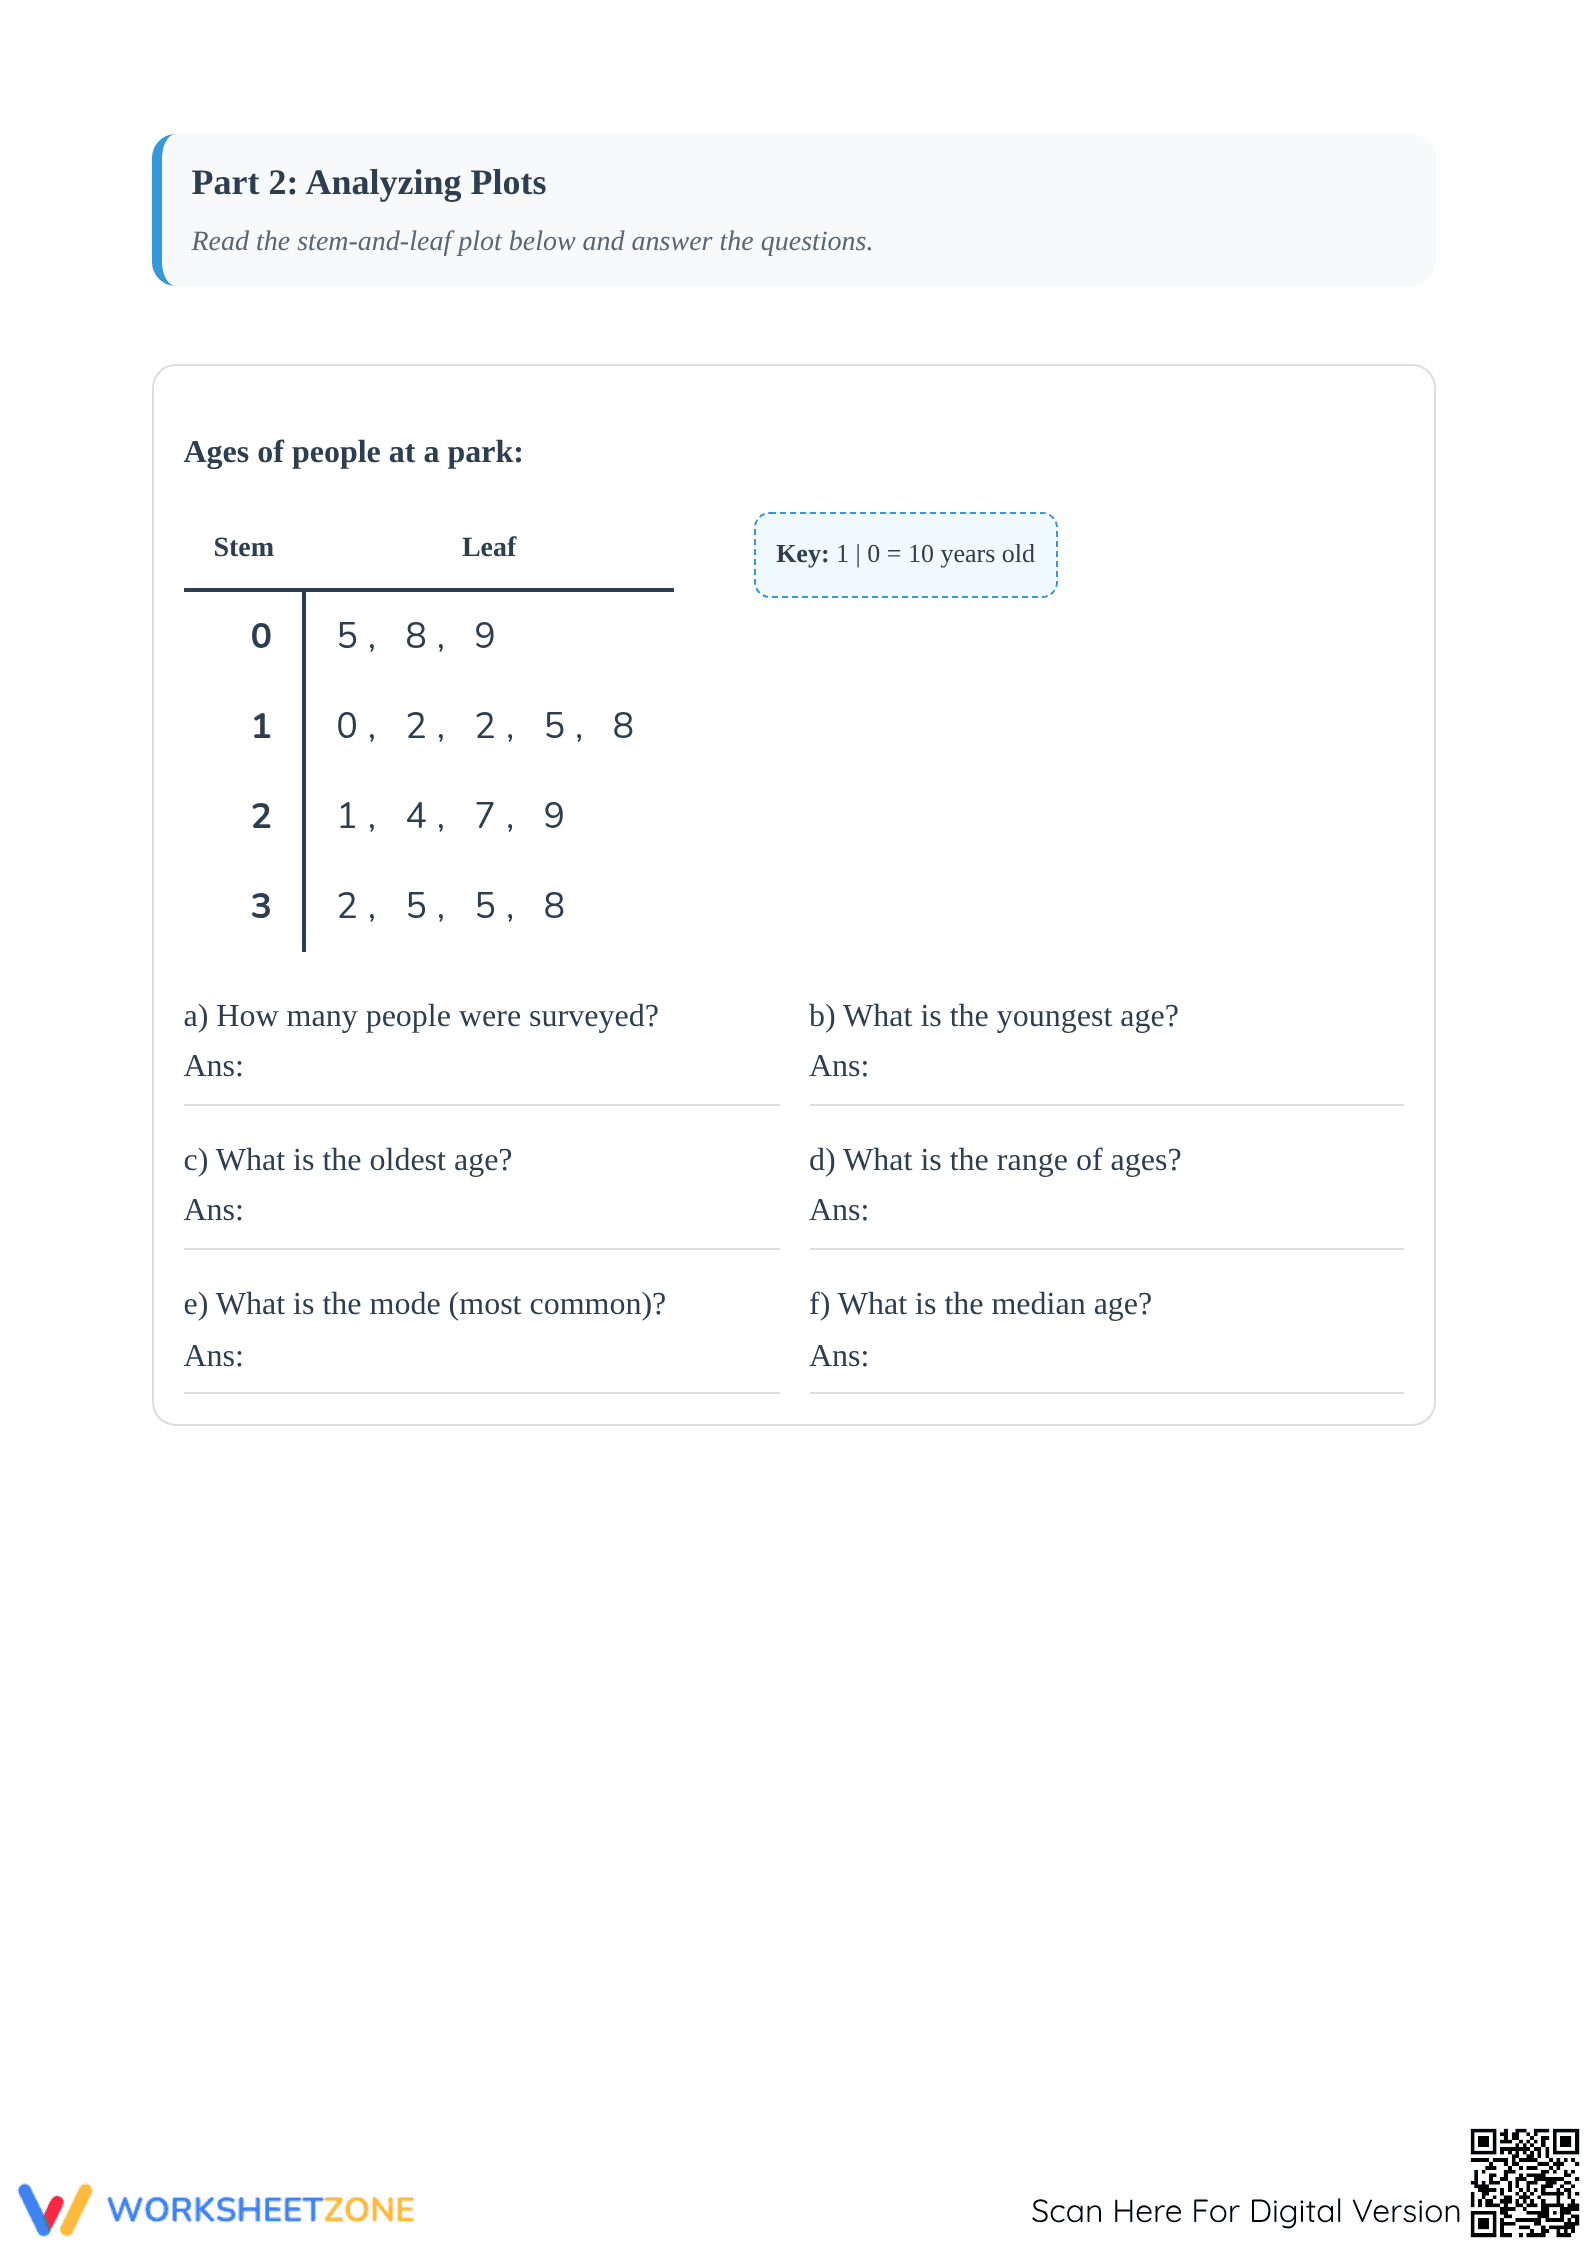
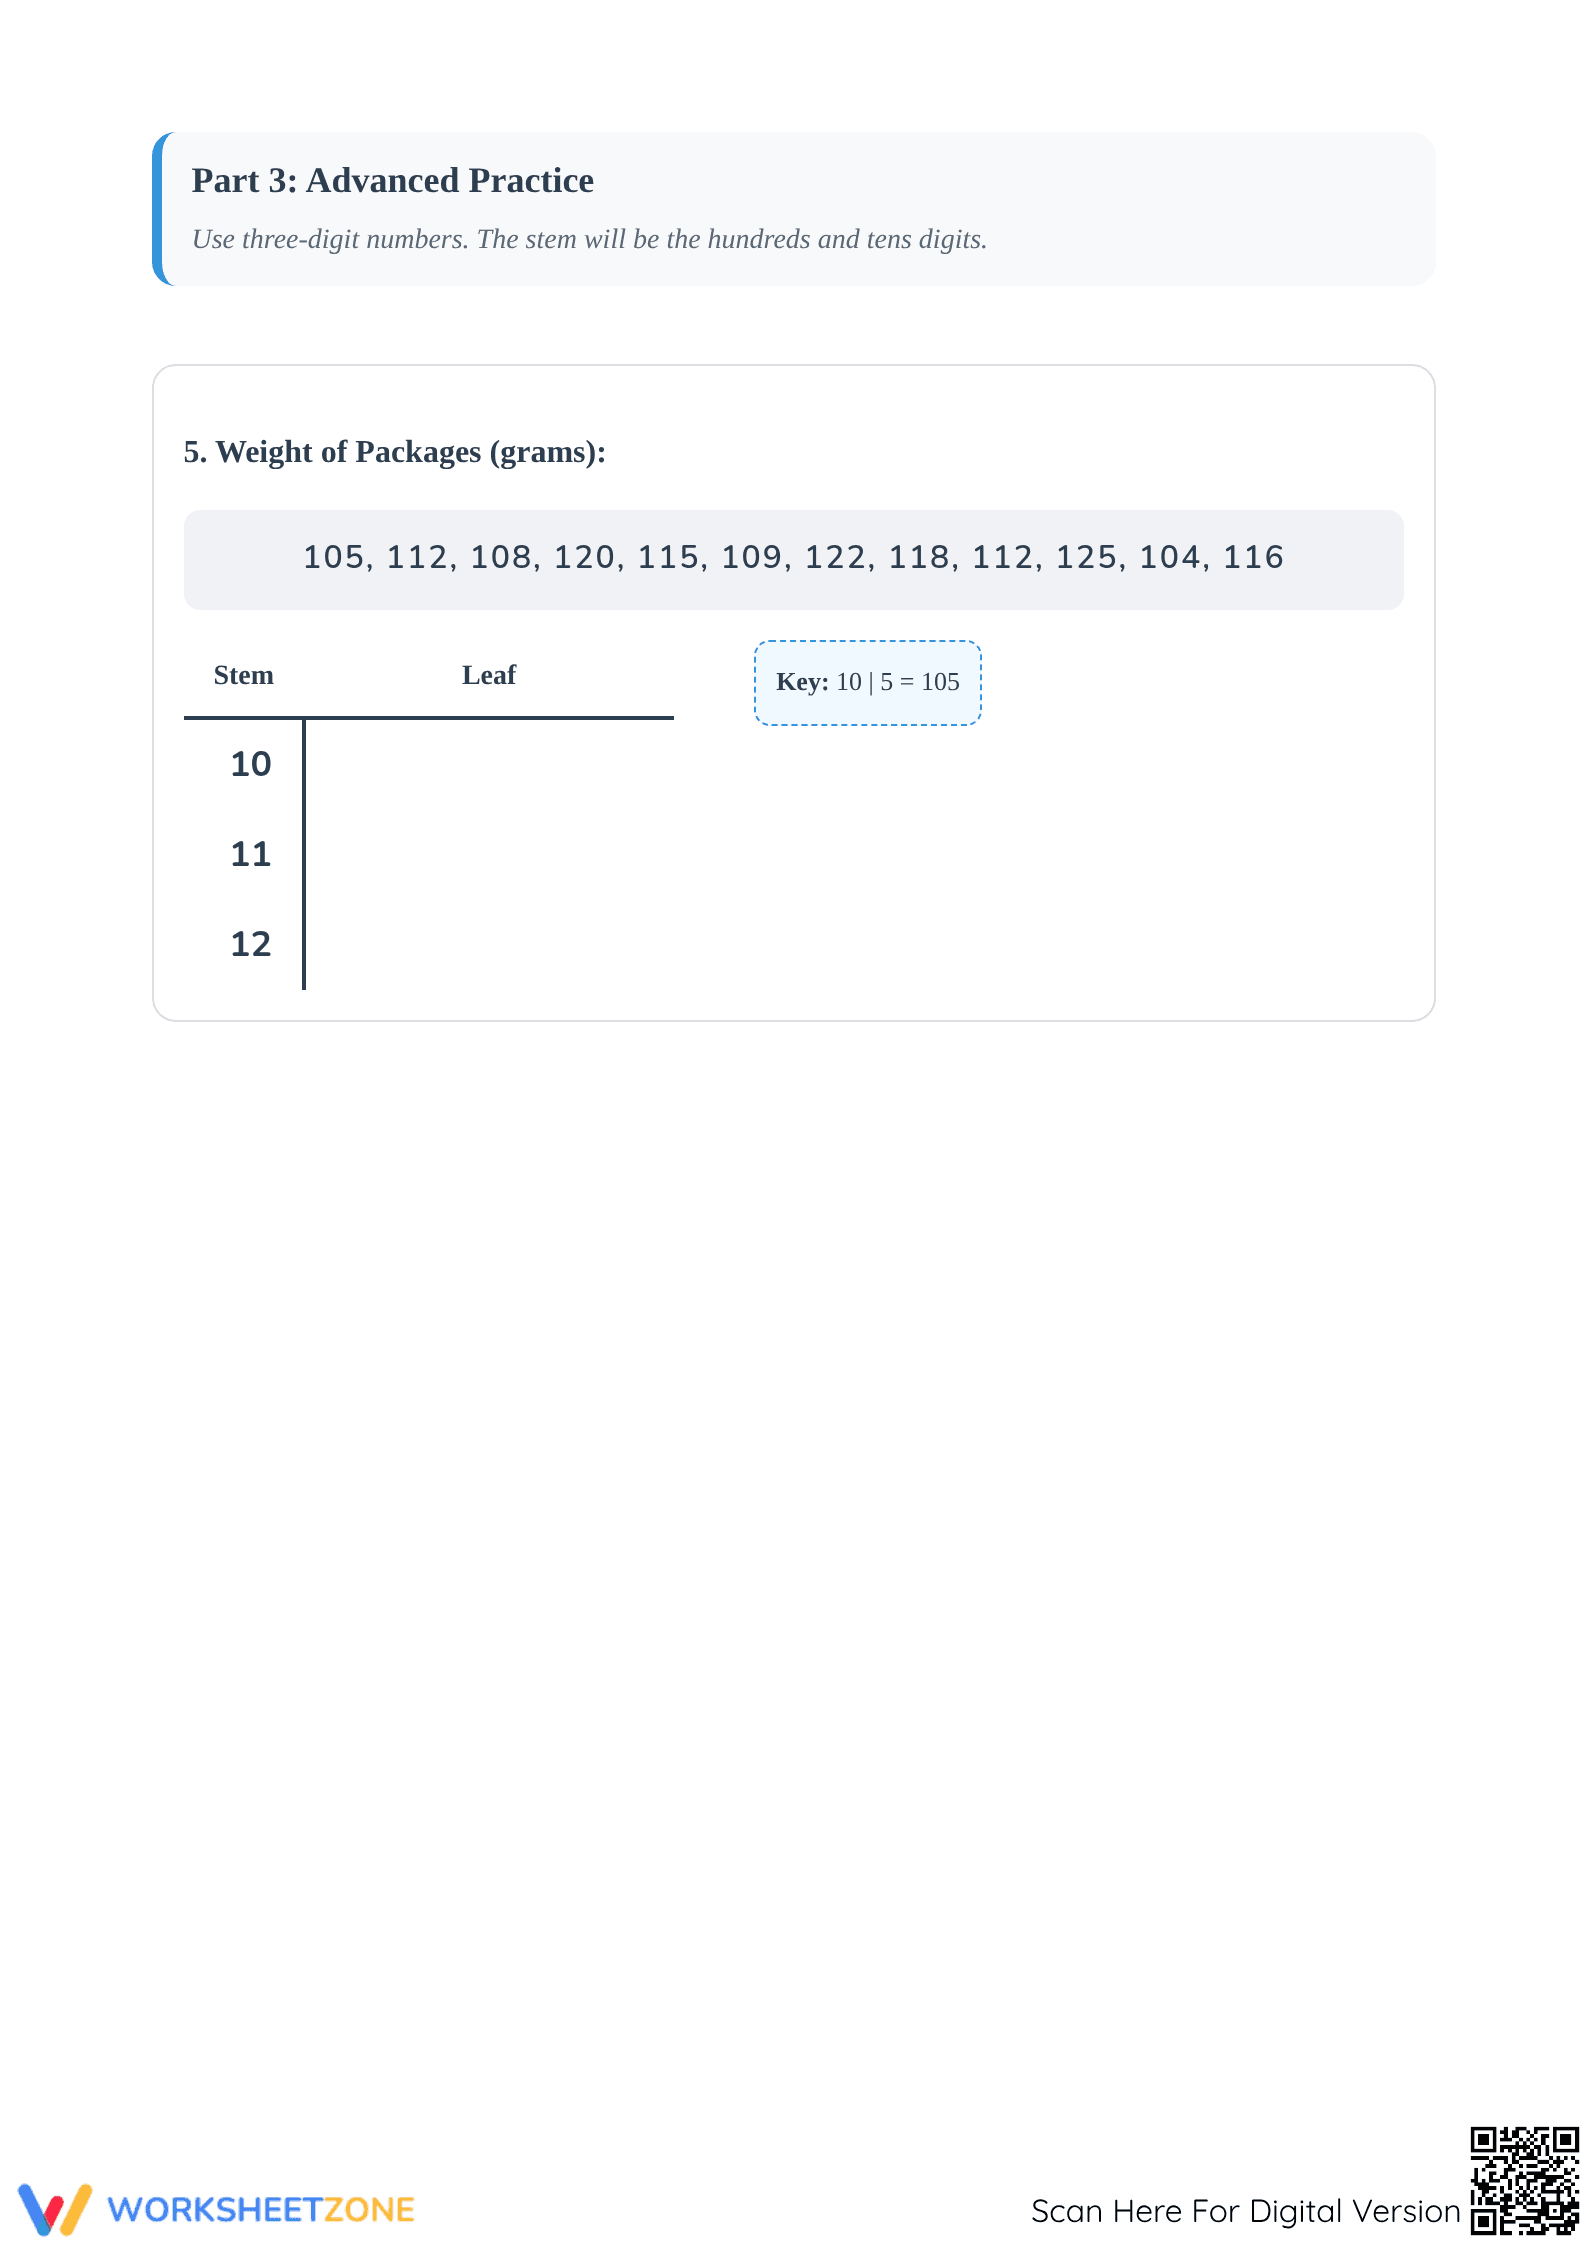
The packet contains four high-quality pages featuring five major data sets. The first three problems focus on construction, requiring students to sort raw data into stems and leaves. The fourth section provides a pre-populated plot for analyzing measures of center and spread, while the final advanced task introduces three-digit number sets. A full answer key ensures quick grading.
Zero-Prep Workflow
This worksheet is designed for immediate classroom implementation with prep time under two minutes. Teachers simply print the four-page PDF and distribute it. Clear, self-explanatory instructions allow students to work independently. The structured layout and pre-drawn templates minimize the need for supplemental materials, making it an ideal choice for substitute lesson plans.
Standards Alignment
Primary alignment is CCSS.MATH.CONTENT.6.SP.B.4, requiring students to display numerical data in plots. Additionally, the analysis portion supports CCSS.MATH.CONTENT.6.SP.B.5.C by asking for quantitative measures of center and variability. Both standard codes can be copied directly into lesson plans, IEP goals, or district curriculum mapping tools.
How to Use It
Use this resource mid-unit to transition from frequency tables to complex distributions. A formative assessment tip is to observe the "Advanced Practice" section on page four. If students correctly identify the tens and hundreds digits as the stem for 100+ values, they have mastered the structural logic. Expect completion in 40 minutes.
Who It's For
This resource is built for Grade 6 math, though it serves as enrichment for Grade 5 or remediation for Grades 7 and 8. It pairs naturally with Place Value lessons or digital data collections. The multi-page format allows for flexible pacing across different student ability groups.
According to the RAND AIRS 2024 report, high-quality mathematical instructional materials that balance procedural fluency with conceptual analysis significantly improve student retention in statistics. This worksheet achieves that balance by requiring students to first construct a data display before interpreting its statistical meaning. By aligning with CCSS.MATH.CONTENT.6.SP.B.4, the resource ensures that Grade 6 students develop the precise data-handling skills necessary for higher-level algebra and probability. The inclusion of three-digit data points aligns with research suggesting that increasing complexity in data sets prevents student over-reliance on single-digit patterns, fostering a deeper understanding of the relationship between place value and data organization. Educators can cite this resource as a standards-aligned tool for building both the "how" and "why" of numerical data plots in a structured middle-school environment. This 4-page packet provides the rigorous practice needed for mastery.