Discover the power of Grade 5 Stem and Leaf Plot Worksheets, thoughtfully crafted for teachers, homeschoolers, and parents who want purposeful, skill-building practice. Each worksheet in the collection helps reinforce key concepts, sharpen academic skills, and promote critical thinking in a structured, engaging format. Whether you’re preparing in-class activities, take-home packets, or review sessions, these resources save you planning time while boosting student confidence. Unlike random online printables, Grade 5 Stem and Leaf Plot Worksheets offer age-appropriate, standards-aligned, and print-ready materials you can trust. Organized by topic for easy access, it’s the smart way to deliver targeted practice that supports learning at every stage. Make instruction more effective and consistent with Grade 5 Stem and Leaf Plot Worksheets—your go-to resource for high-quality worksheets that work in every learning environment.
More additional
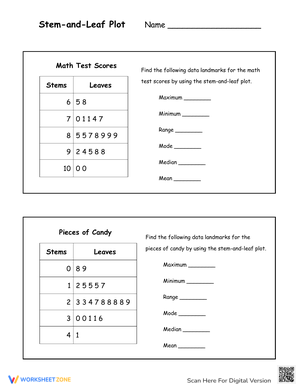
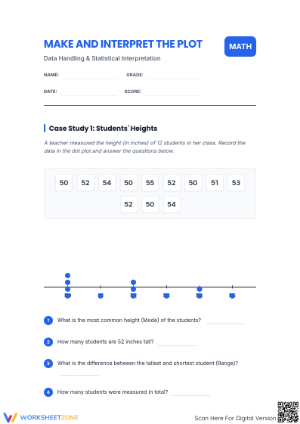
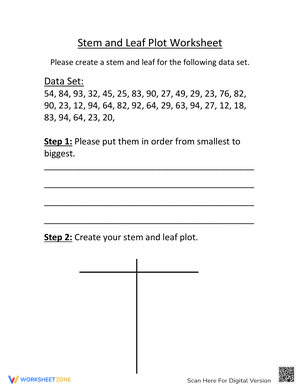
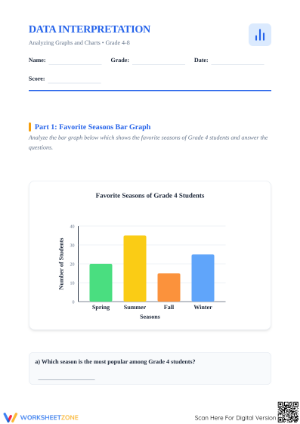
Grade 5 Data worksheets