Unlock the full potential of Printable Grade 4 Stem and Leaf Plot Worksheets, ideal for classroom stations, take-home learning packets, or enrichment centers. Every worksheet is carefully quality-checked, clearly structured, and thematically organized to align with your teaching goals. With built-in answer keys and easy-to-follow instructions, you can save time and reduce prep stress. Say goodbye to disorganized, low-quality downloads - Printable Grade 4 Stem and Leaf Plot Worksheets deliver a cohesive toolkit that keeps students engaged and learning on track. These ready-to-use materials help you differentiate instruction, offer targeted review, or assign meaningful extra practice with confidence. Designed for real-world classrooms and home environments alike, Printable Grade 4 Stem and Leaf Plot Worksheets empowers educators and parents to teach smarter, support student success, and stay focused on what matters most: effective learning.
More additional
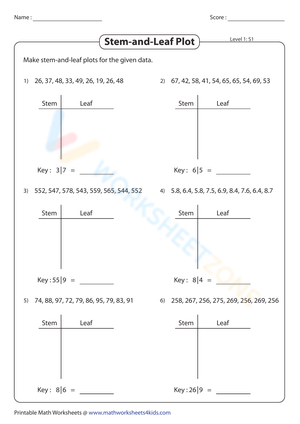
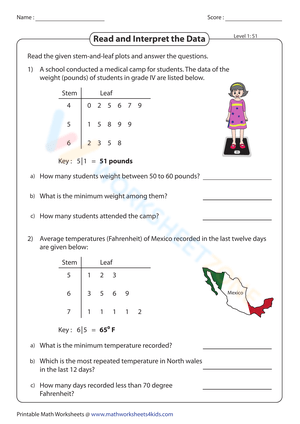
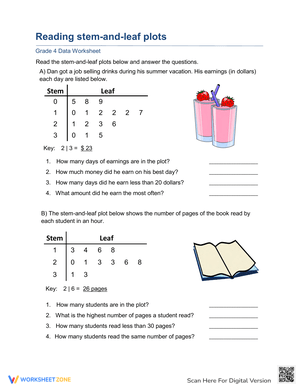
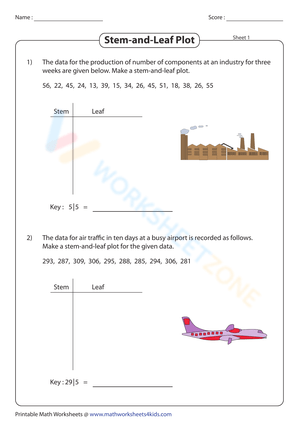
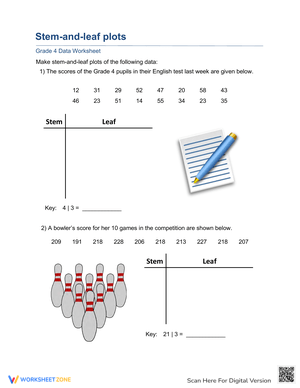
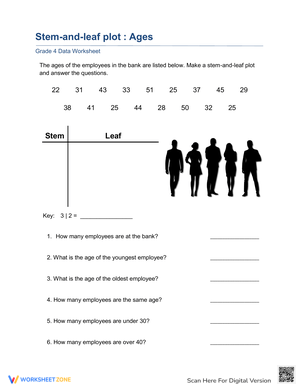
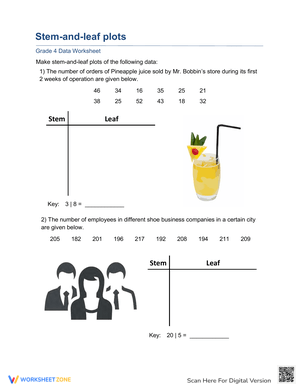
Grade 4 Data worksheets