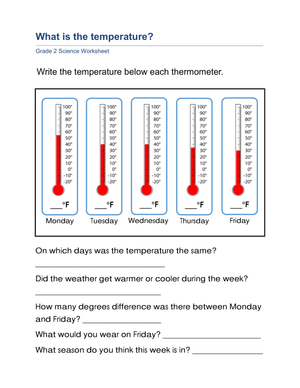
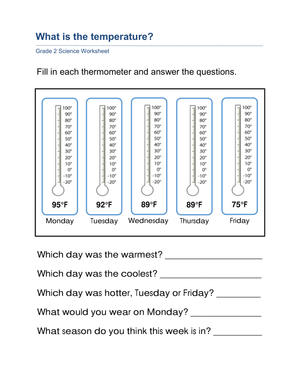
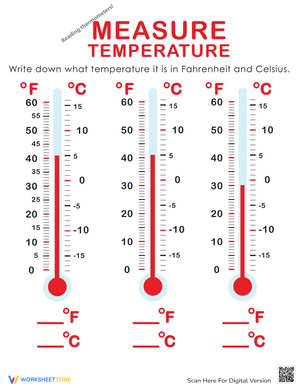
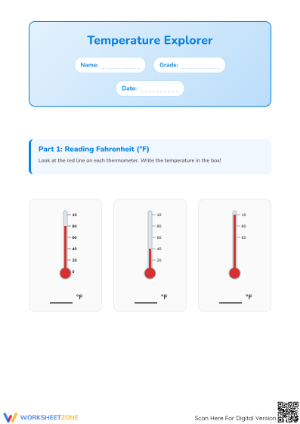
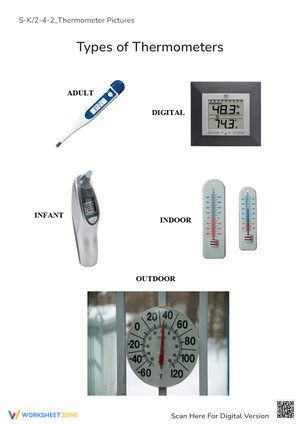
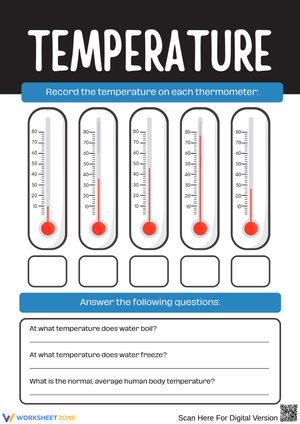
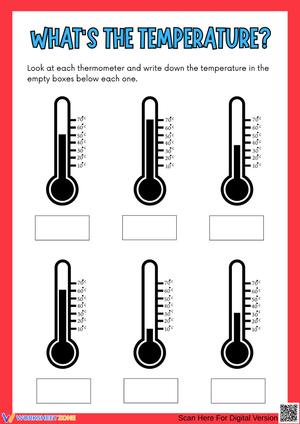
These reading a thermometer worksheets for 2nd grade give teachers a concrete way to move weather science out of bulletin board territory and into actual measurement practice. Each worksheet targets the mechanics second graders need most: locating the top of the liquid column, matching that level to a marked number, and using comparison words like warmer, colder, and hotter than to describe two readings side by side. The set works inside a Grade 2 weather unit without requiring any prior measurement experience from students.
The Skills Each Worksheet Targets
Second graders are developmentally ready to observe and compare—but not ready for conversion formulas or decimal readings. These worksheets stay in that zone, using whole-number values, clearly marked scales, and familiar weather contexts. The specific tasks across the set include:
- Identifying the parts of a thermometer—bulb, liquid column, and numbered scale
- Reading the top of the liquid to find the temperature, not the bottom or the outside edge
- Matching a thermometer reading to a weather scene such as a snowy day, a sunny afternoon, or a rainy morning
- Comparing two or three temperatures and circling the warmest or coldest
- Ordering a small set of readings from lowest to highest
- Recording temperatures using numerals and the degree symbol
The comparison tasks in reading a thermometer worksheets for 2nd grade carry more instructional weight than they first appear to. When a child marks which of three thermometers shows the coldest day, they are doing early data interpretation—not just number reading. That connection to observation and evidence is what makes thermometer work worth sustained time in Grade 2 science, rather than treating it as a two-day novelty before moving on.
Reading Mistakes Students Make—and What to Watch For
The most common error is reading the nearest printed number rather than tracking where the liquid actually stops. A student might see 70°F printed near the middle of the scale and circle it immediately, without noticing the liquid column ends at 65°F. This happens because young readers often treat printed numbers as anchors and skip the actual measurement step. Consistent routine practice is the fix: find the bottom of the scale, count upward in increments, and stop exactly where the liquid ends.
A subtler problem—one that surfaces most when teachers are watching the whole class rather than one student at a time—is reading the bottom of the liquid column instead of the top. The colored fill runs from the bulb all the way up, and second graders often anchor on the widest, most visually prominent part of the image, which is the bulb, not the tip of the column. One effective modeling move: hold up a large projected thermometer image and trace upward slowly with your finger until you stop at the very tip of the liquid. Do it twice, narrating as you go. That physical demonstration does what re-explanation alone usually cannot.
Scale confusion is the third pattern to anticipate. When a worksheet uses increments of 2 (60, 62, 64…) and the liquid lands on an unmarked line, most students either guess or leave the space blank. For Grade 2, worksheets that mark every even number and keep the range to a 40-degree span reduce that confusion without softening the core measurement task.
Fitting These Worksheets Into Your Science Week
The most reliable spot for reading a thermometer worksheets for 2nd grade is the opening five to eight minutes of a science lesson, run alongside the day's weather check. After students record the outdoor temperature on the class chart, they complete one worksheet independently while you take attendance or set up materials. That parallel structure—real observation tied to worksheet practice—bridges the gap between abstract skill work and actual scientific observation in a way a standalone worksheet day rarely does.
Science centers are a strong alternative. A thermometer station with crayons, a small set of weather picture cards, and two or three worksheets keeps a group busy for a full rotation without close teacher oversight. Students sort the picture cards by temperature, complete the corresponding worksheet, and check each other's answers before rotating out. It runs itself once the reading routine is established.
For classrooms that track daily weather during morning meeting, assign one worksheet at the start of Monday and return to it briefly on Wednesday as a comparison task. Students mark Monday's temperature, then on Wednesday circle whether the new reading is warmer or colder—two data points across one week, no extra materials required.
Adjusting the Work for Mixed Readiness Levels
Students who are still shaky on number order below 50 benefit from a reduced scale. Covering the upper half of the thermometer with a sticky note so they focus only on the relevant range—30°F to 60°F for a winter lesson, for instance—keeps the measurement goal intact while lowering the visual load of a full scale.
For students ready to push past basic reading, add comparison tasks that require a written explanation. "How do you know Tuesday was colder than Thursday?" applies the same thermometer-reading skill to evidence-based reasoning, which is the right extension for second graders who have already secured the foundational steps. A small group doing that task alongside peers doing the standard matching version means one worksheet serves two readiness levels in the same lesson block—no separate materials needed.
English language learners benefit from worksheets that pair scale values with picture support—a coat icon next to a cold reading, a sun next to a warm one. Most of the tasks in the set (circling, coloring, drawing an arrow to the correct reading) produce clear student evidence without requiring much written English, which keeps the science work accessible during early language acquisition.
Standard Alignment
These worksheets connect most directly to the NGSS practice of using data to describe patterns, as that practice appears in Grade 2 weather and climate content (2-ESS2-1). Reading and comparing temperatures qualifies as structured data collection—introduced at this grade as observational practice rather than formal data analysis. Students are not expected to explain why temperatures change; they are expected to observe, record, and compare.
For teachers working with state standards closely aligned to NGSS, these worksheets sit inside the weather observation strand that typically falls in the first or second quarter of second grade. The comparison and ordering tasks also overlap with reading and comparing two-digit numbers, a Grade 2 math standard, which makes occasional co-planning with math instruction worth considering.
Frequently Asked Questions
Should I use Fahrenheit or Celsius worksheets with second graders?
Either works at this level, and the choice usually follows your science curriculum rather than student ability. If your school tracks daily weather in Fahrenheit, use Fahrenheit worksheets so students can transfer the skill immediately to the classroom thermometer they already see. If you are building toward Celsius fluency, introduce it early with round, familiar values: 0°C, 10°C, 20°C, 30°C. What matters at Grade 2 is the reading process, not which scale students memorize first.
How many thermometer readings should appear on one worksheet for beginners?
Two to four thermometers per worksheet is the right starting range. More than four at once increases visual load and leads to careless errors—not because students don't understand the skill, but because they rush or lose track of which answer belongs to which image. Once students can read all four without hesitation, they are ready for comparison and ordering tasks.
Can these worksheets be used during math instead of science?
Yes. Reading a thermometer worksheets for 2nd grade turn up naturally in measurement or data units—temperature reading overlaps with number line work, two-digit comparison, and basic data interpretation, all of which appear in Grade 2 math standards. Teachers who block math and science in the same afternoon sometimes use these worksheets as a bridge between the two. That said, keeping the weather framing intact makes the temperature values feel purposeful rather than arbitrary.
What if my students have never handled a real thermometer?
Bring one in before distributing the first worksheet. A two-minute class observation—holding up a thermometer, pointing to the liquid column, reading the number aloud together—gives students a physical reference that a printed image alone cannot provide. After that brief introduction, the worksheet images become significantly more legible to students who were previously unsure what they were even looking at. It costs almost nothing and reliably improves accuracy on the first attempt.












 Interactive Worksheet Maker
 Quiz Maker
 Word Search Maker
 Crossword Puzzle Maker
 Word Scramble Generator
 Sentence Scramble Generator
 Handwriting Worksheet Generator
 Name Tracing Generator
 Fill In The Blank Generator