


Views
Downloads

Printable Finding the Mode Worksheet | Grade 3 Math
Paste this activity's link or code into your existing LMS (Google Classroom, Canvas, Teams, Schoology, Moodle, etc.).
Students can open and work on the activity right away, with no student login required.
You'll still be able to track student progress and results from your teacher account.
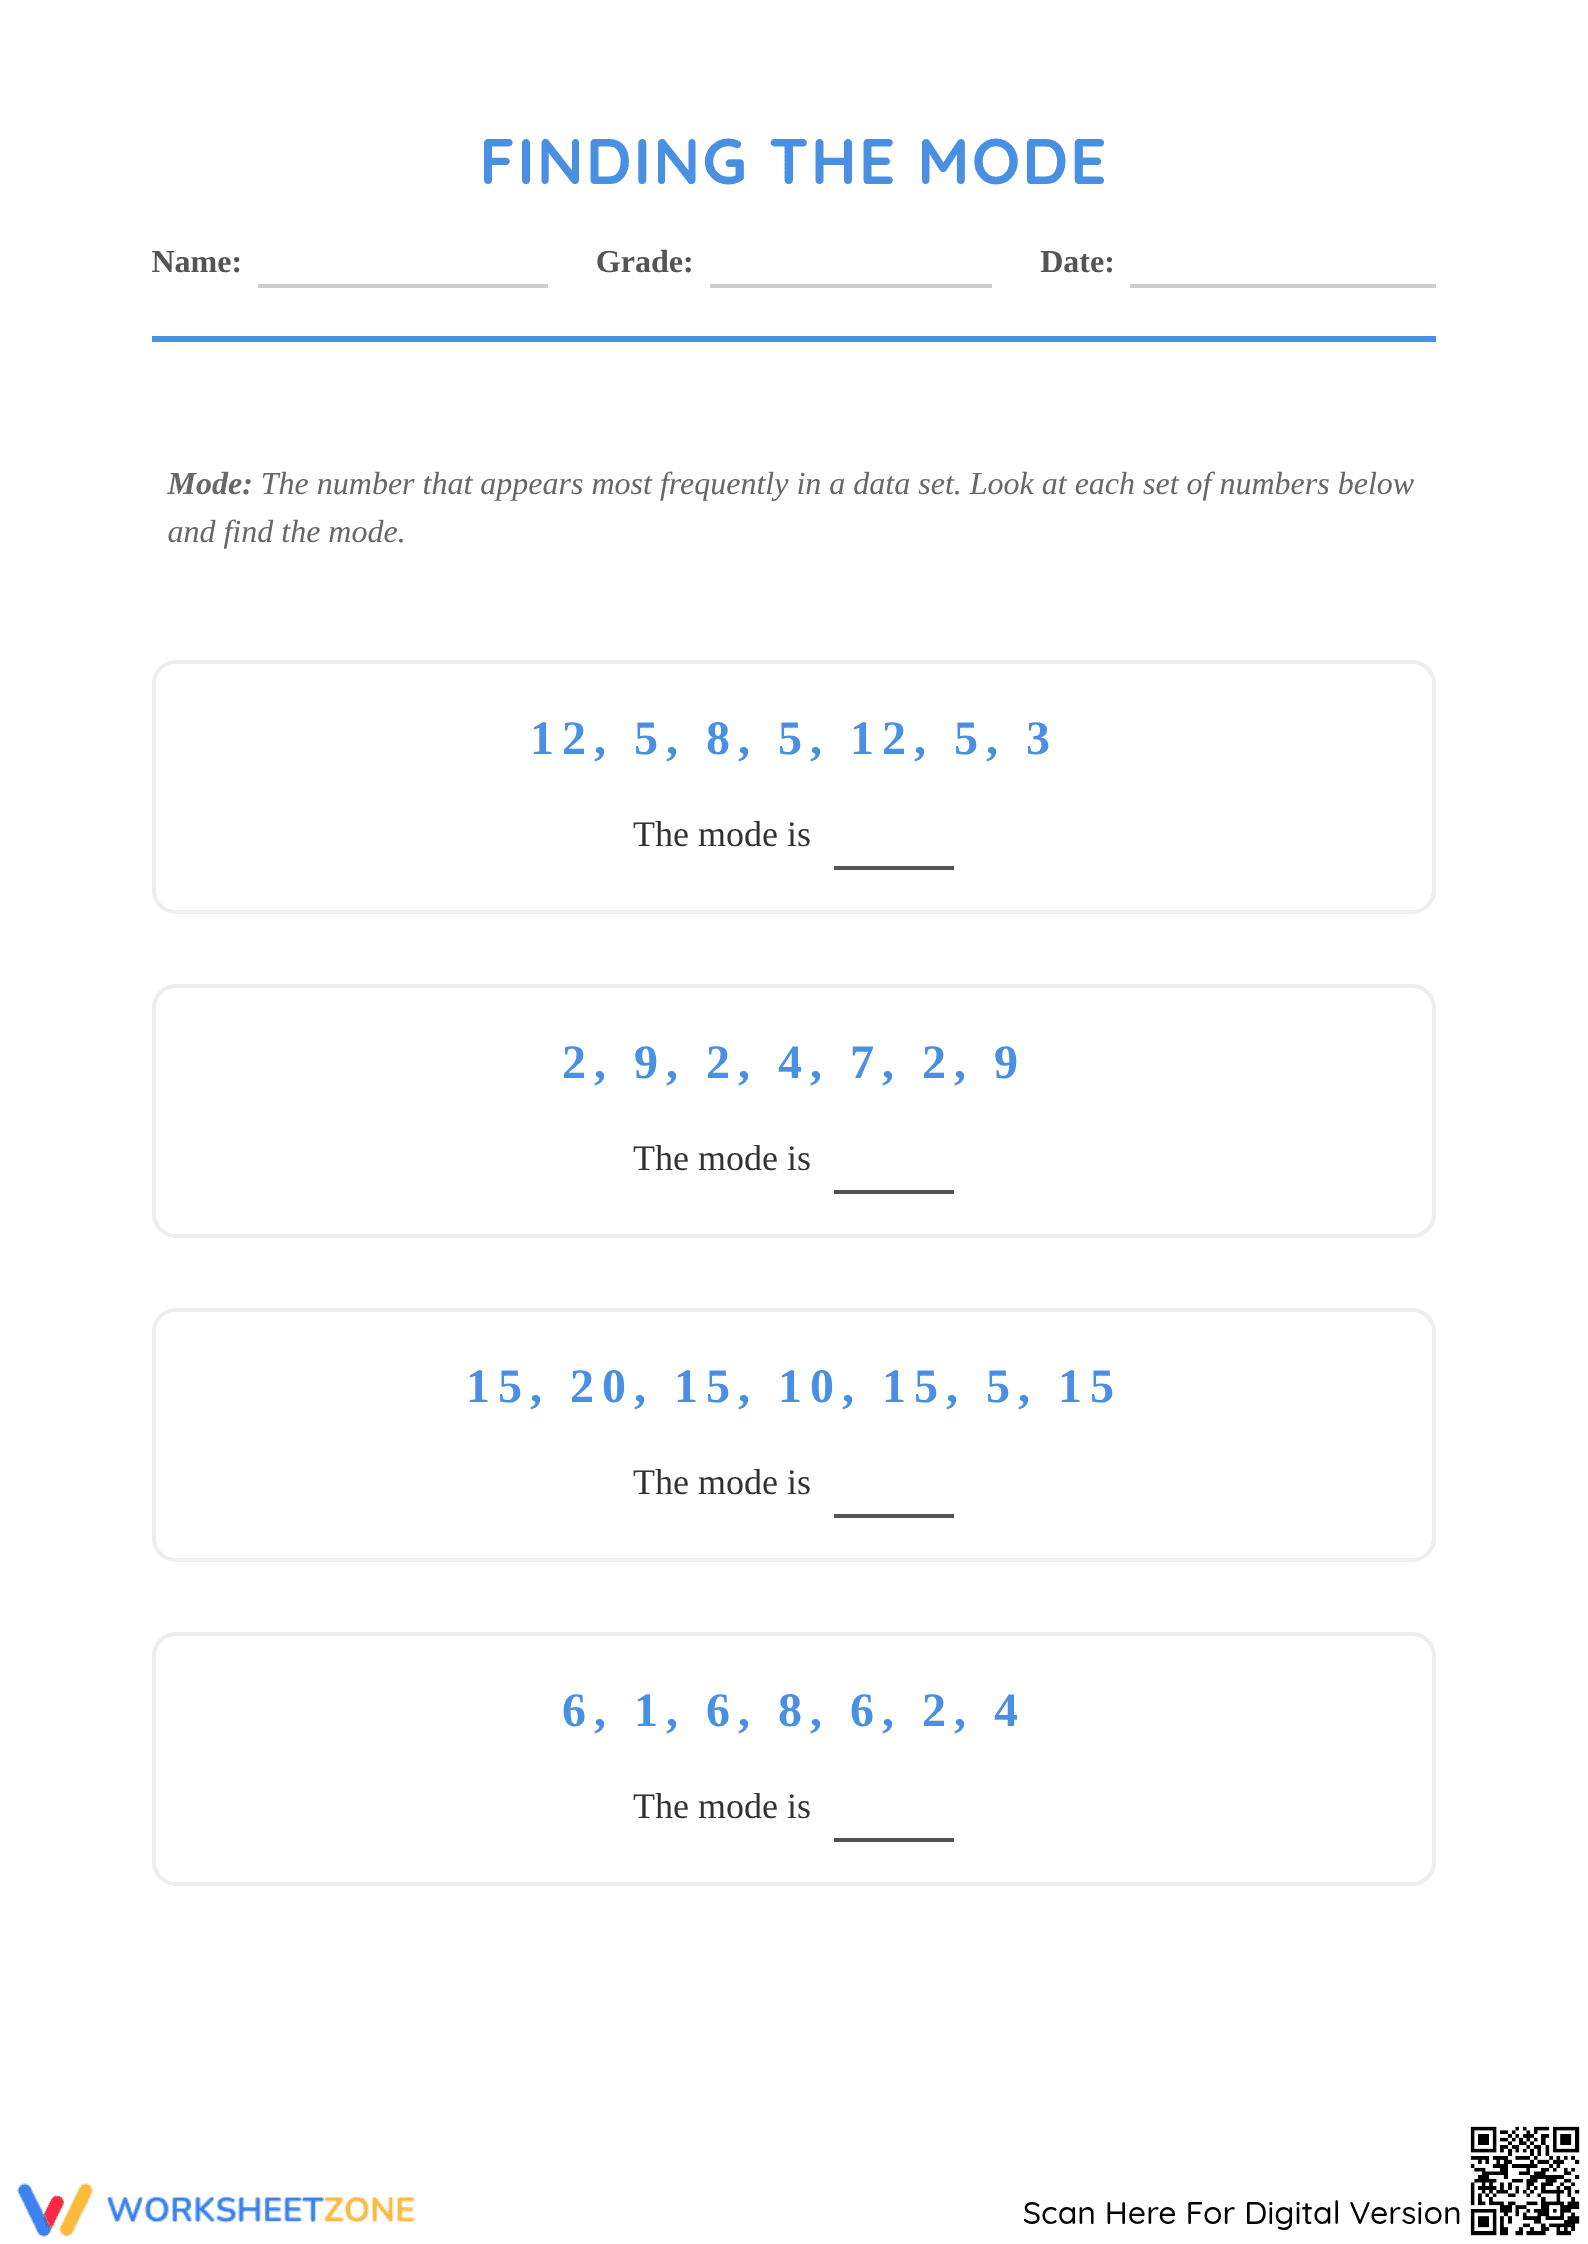
This worksheet offers targeted practice for Grade 3 students on finding the mode in a data set and making simple predictions. Through a series of clear problems using tables and bar graphs, students will strengthen foundational data analysis skills and build confidence in interpreting basic statistical information.
At a Glance
- Grade: 3 · Subject: Math
- Standard:
CCSS.MATH.CONTENT.3.MD.B.3— Represent and interpret data using scaled bar graphs.- Skill Focus: Finding the mode, making predictions from data
- Format: 5 pages · 10 problems · Answer key included · PDF
- Best For: Independent practice, station work, formative assessment
- Time: 20–30 minutes
What's Inside
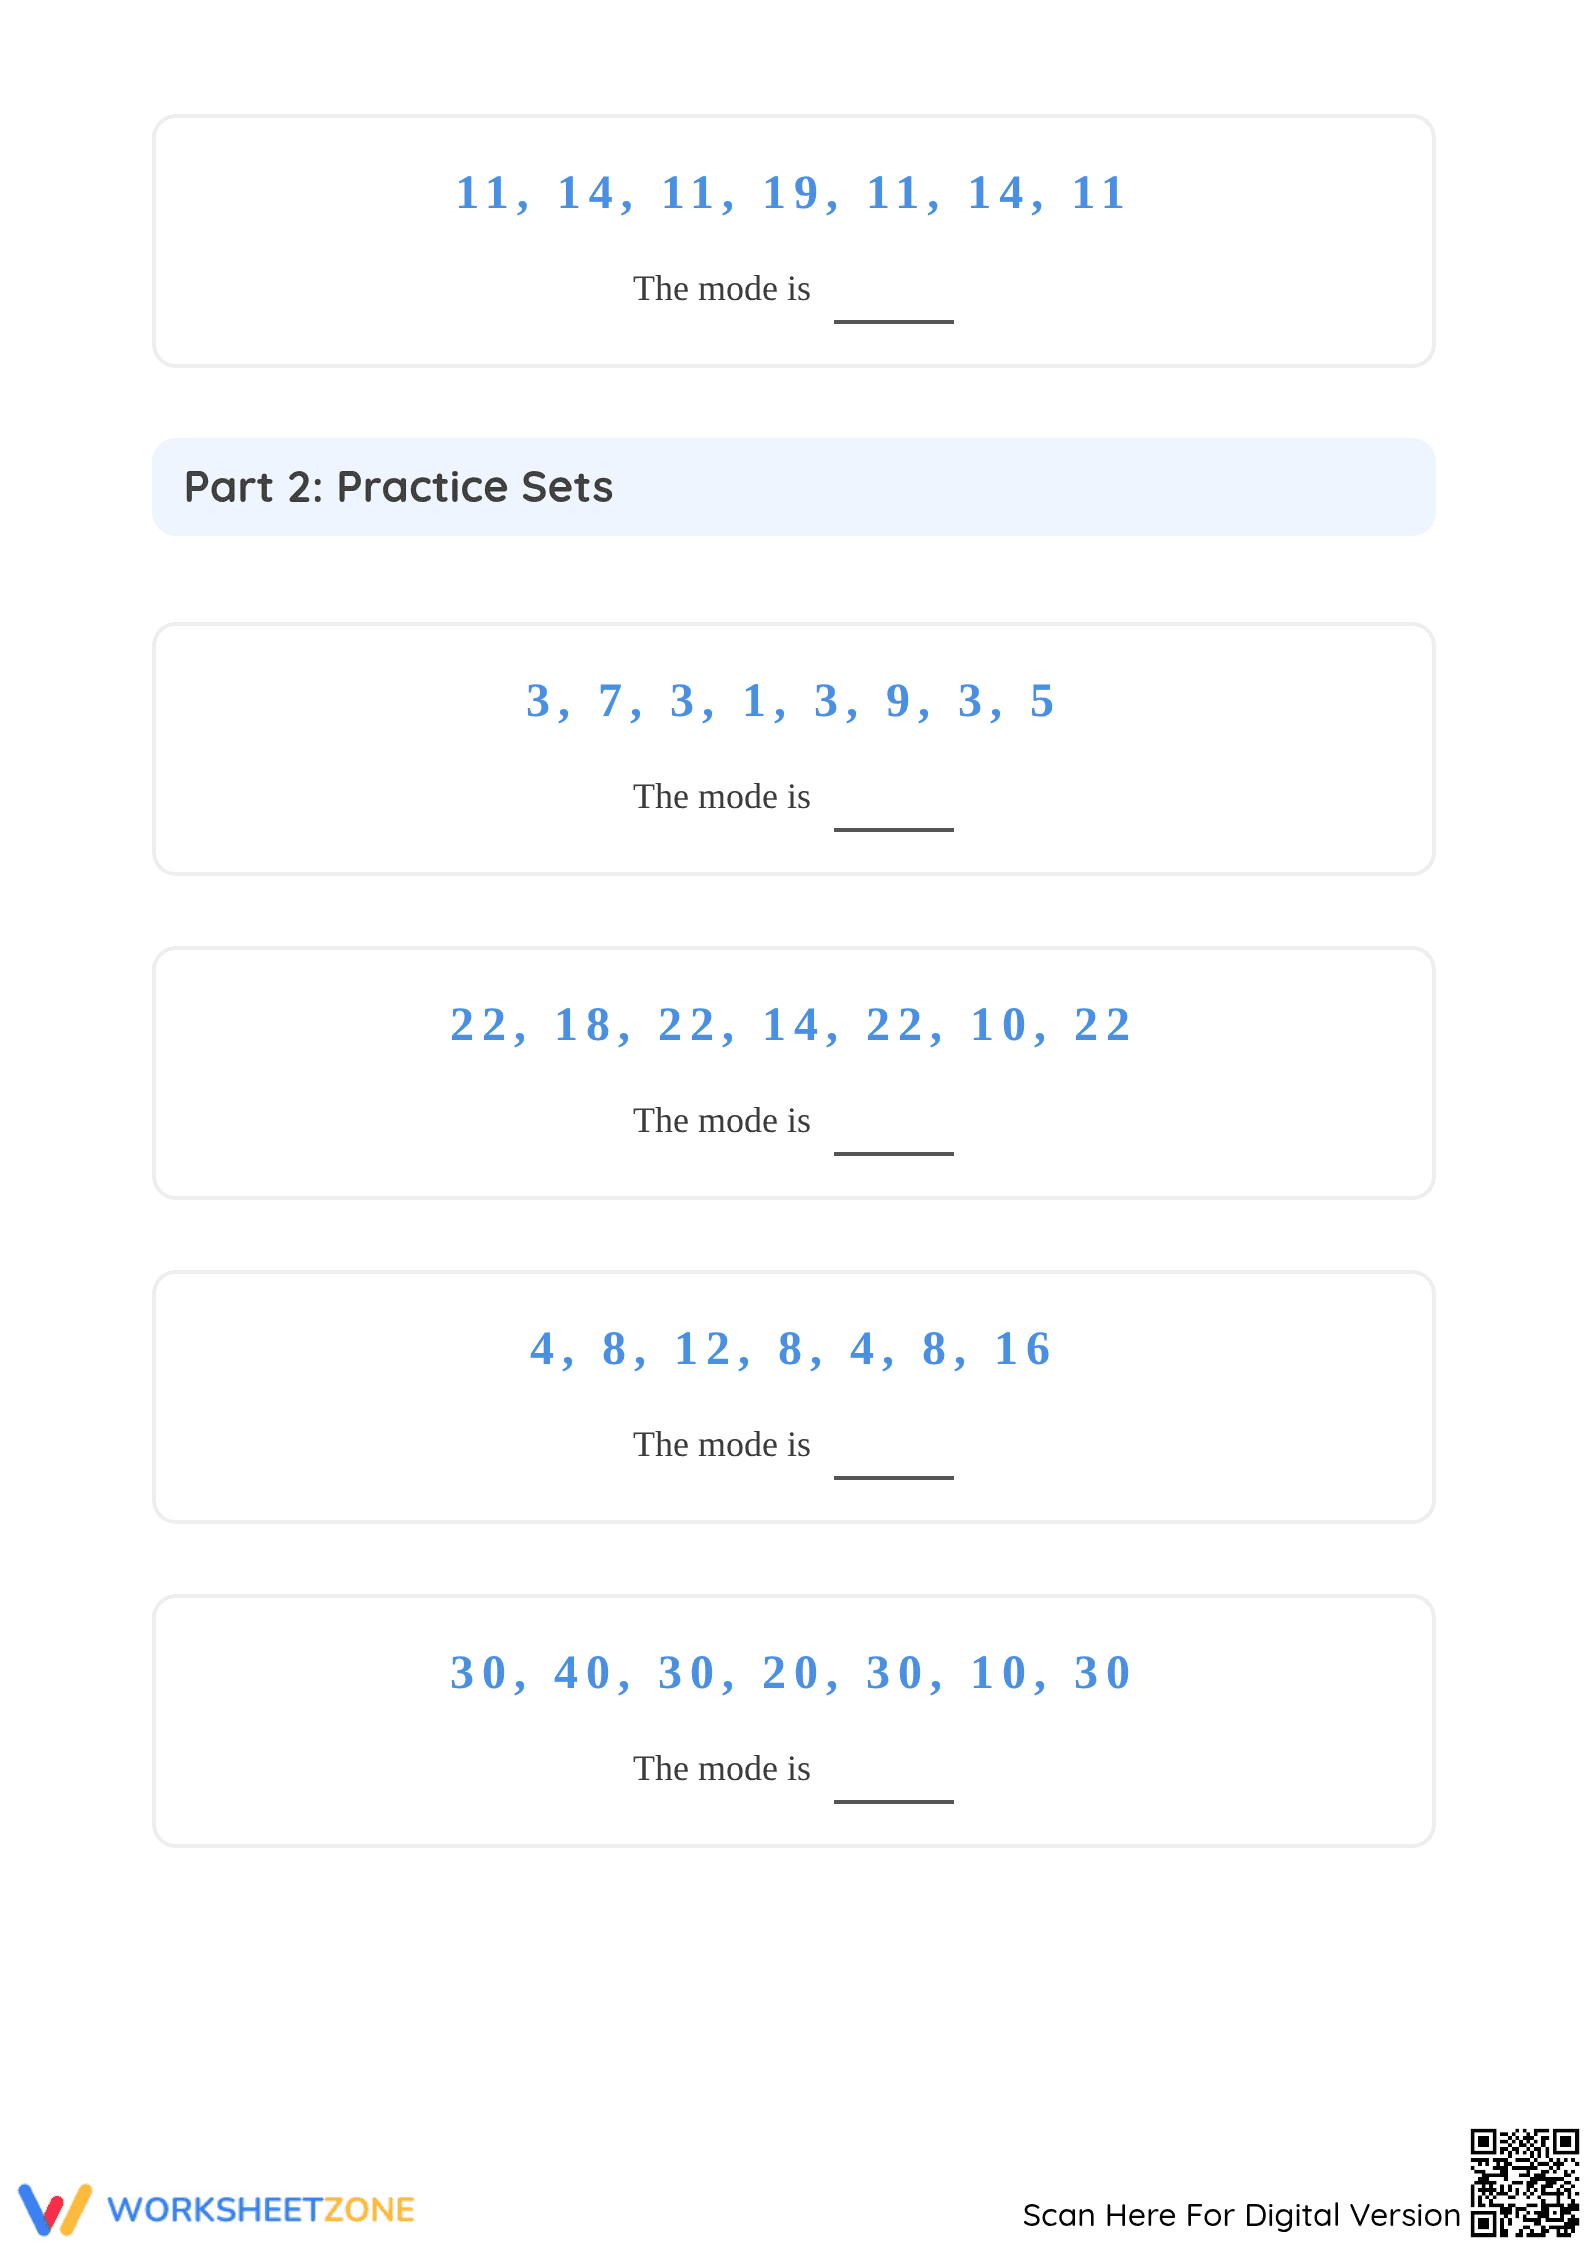
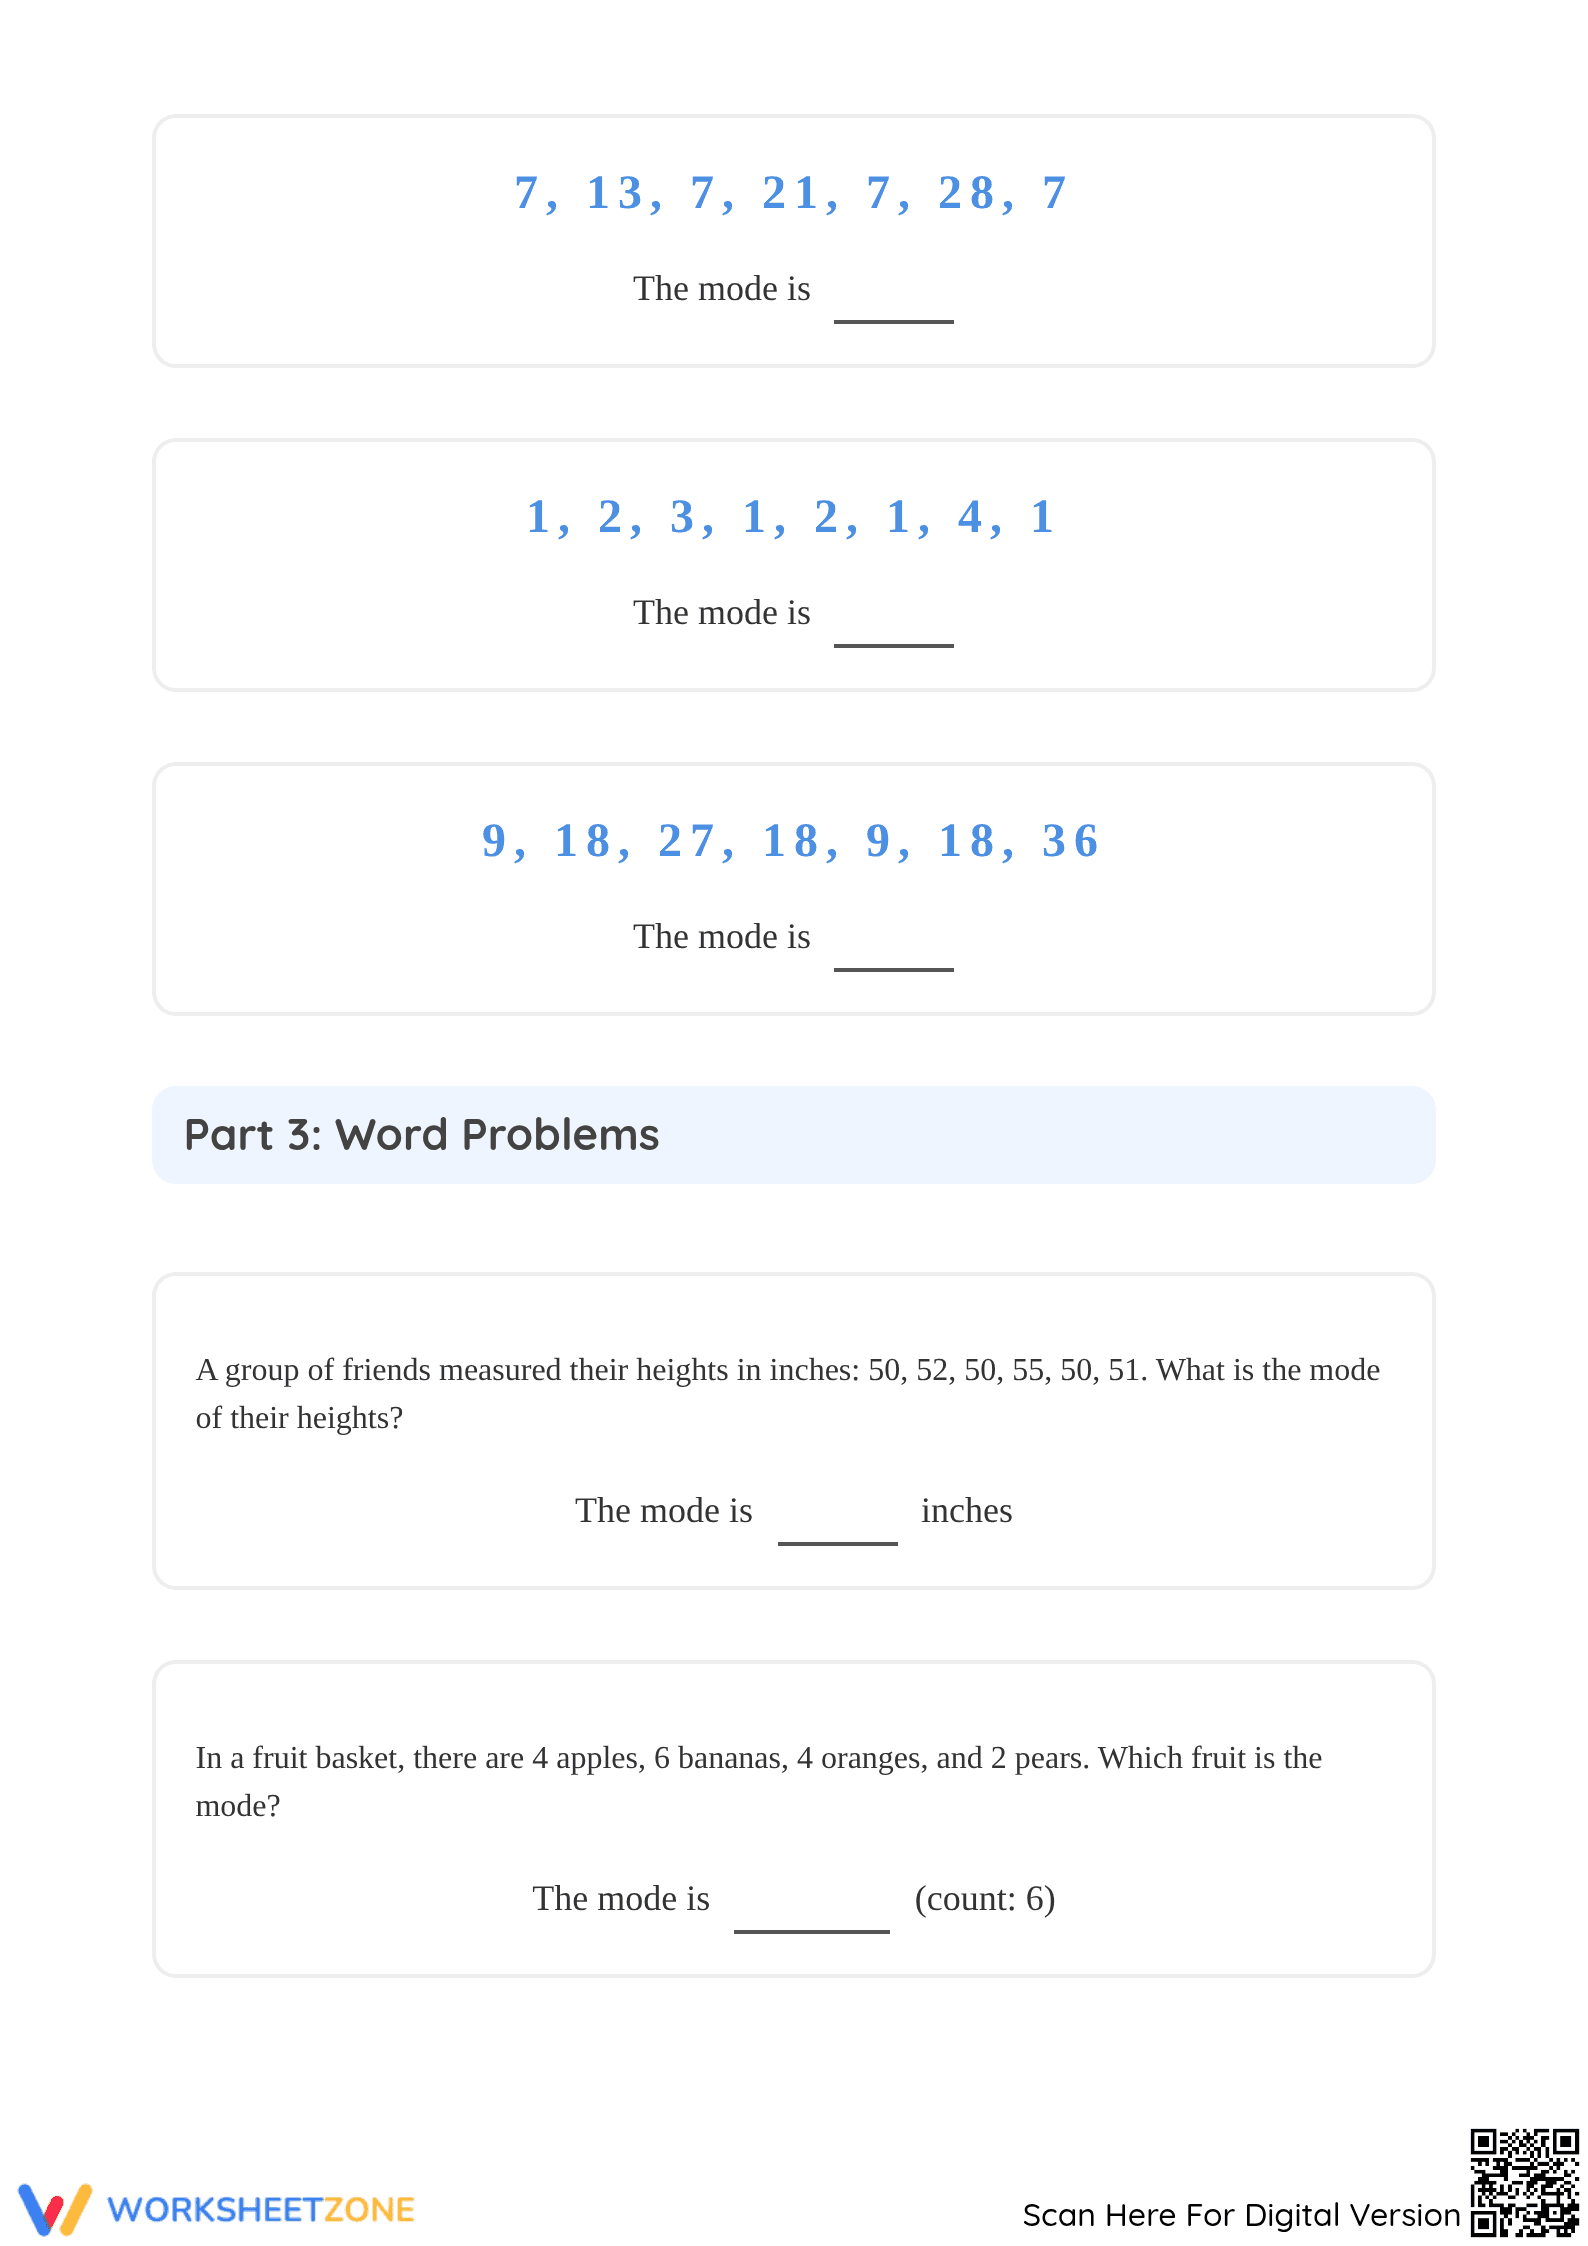
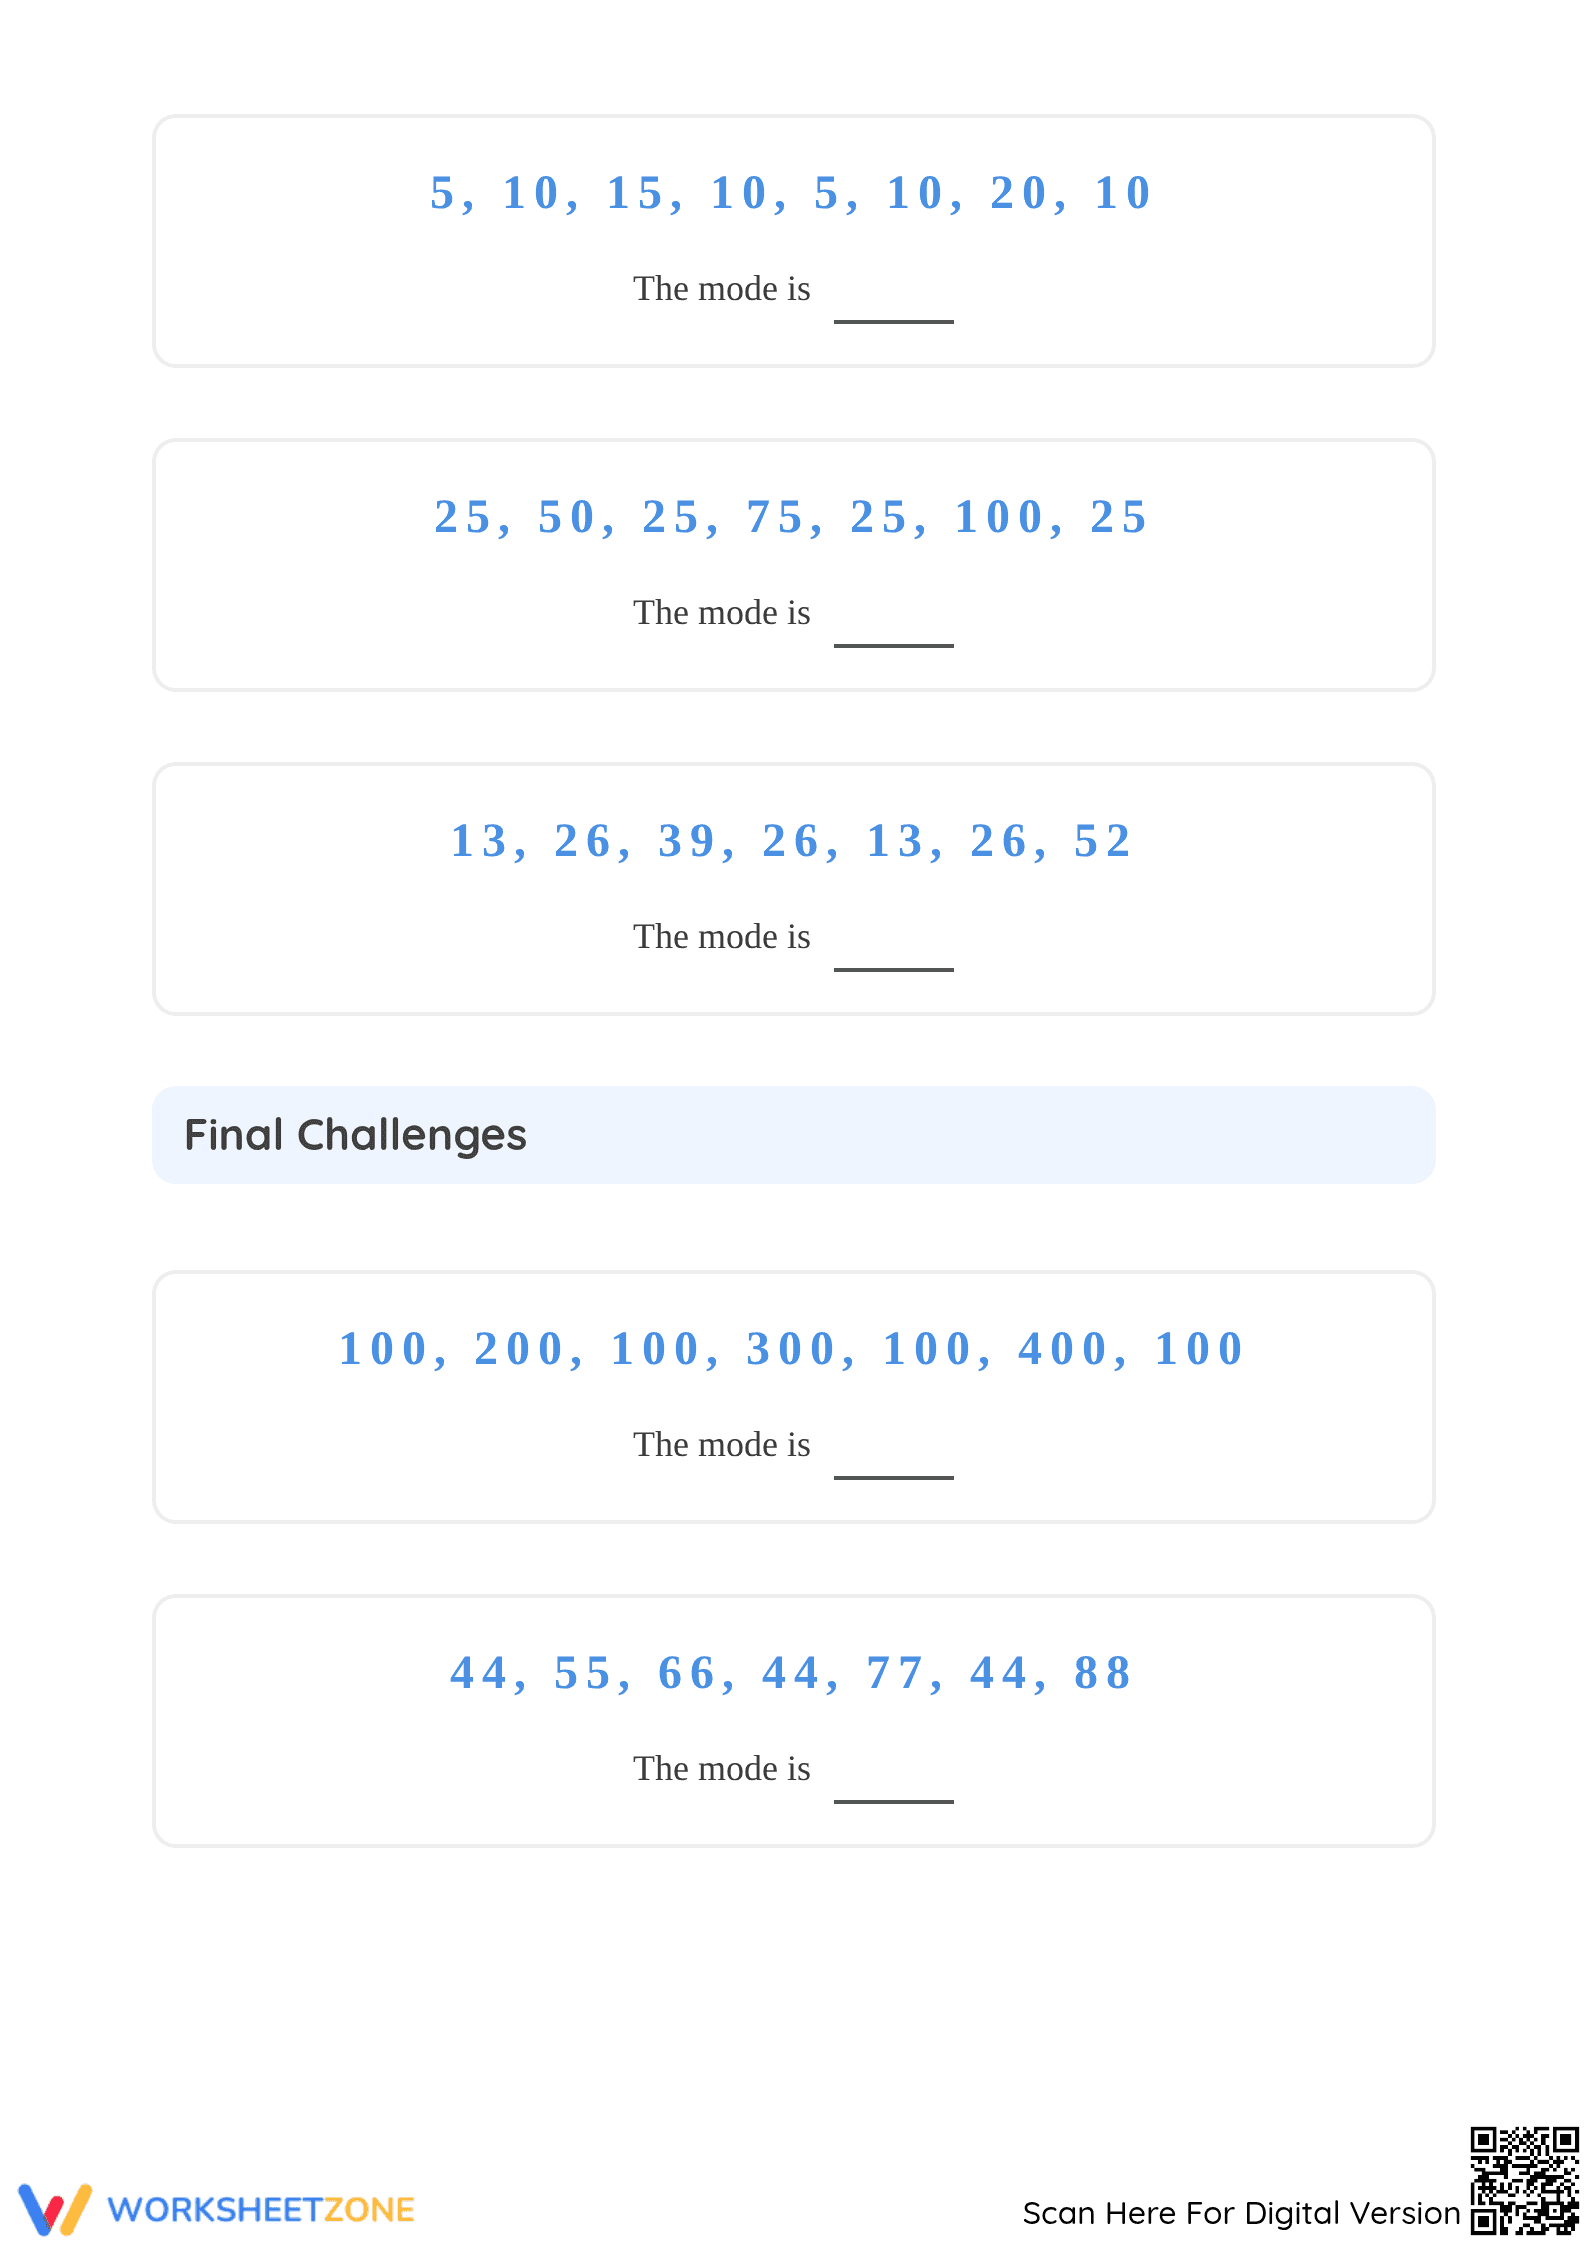
This five-page PDF contains 10 data analysis tasks. Each problem presents a data set in a table or bar chart. Students must identify the mode and then use it to make a logical prediction. A complete five-page answer key is included, showing the correct answers for all problems, making review straightforward for teachers or students.
Skill Progression
The worksheet builds confidence through focused repetition, following a gradual release model.
- Guided practice: Initial problems use simple data sets and bar charts to introduce identifying the most frequent item, serving as an 'I Do' or 'We Do' phase.
- Supported practice: As students progress, the data becomes slightly more complex, but the consistent format allows them to focus on applying the skill.
- Independent practice: The final pages serve as a check for understanding, where students can complete the 10 total problems independently to solidify the skill.
This progression helps students move from needing support to confident application.
Standards Alignment
This worksheet aligns with CCSS.MATH.CONTENT.3.MD.B.3, which involves representing and interpreting data in bar graphs. While finding the mode is a specific skill, this worksheet uses the required format to build foundational data interpretation abilities. The standard code can be copied directly into lesson plans, IEP goals, or curriculum mapping tools.
How to Use It
This resource is versatile. Use it as independent practice after a lesson to check for understanding. It also works well as a self-paced math station activity. For formative assessment, observe which students can quickly identify the mode versus those who must count each item. This reveals their conceptual grasp. Most students should complete the worksheet in 20-30 minutes.
Who It's For
Designed for third-grade students, this worksheet can also serve as a review for fourth graders or an enrichment for advanced second graders. Its clear layout benefits all learners. Pair this resource with a classroom anchor chart defining 'mode' to provide a constant visual support for students during the activity.
Foundational data literacy, like identifying the mode, is a critical building block for statistical reasoning. This worksheet supports CCSS.MATH.CONTENT.3.MD.B.3 by having students interpret data in bar graphs. Research underscores the importance of early exposure to data representation. The RAND AIRS 2024 report on elementary mathematics notes that students in regular, structured data analysis activities show improved problem-solving skills. This resource provides that practice, giving students multiple chances to find the mode and use it for logical prediction. Mastering this concept prepares students for more complex statistics, like mean and median, in later grades.