These water pdf worksheets give K–8 science teachers a collection of standalone printables covering the water cycle, phase changes, molecular properties of H₂O, and freshwater conservation — the four conceptual clusters that appear across nearly every state's elementary Earth science standards. Each worksheet targets one concept at a time, which matters for a subject where students routinely conflate processes that look deceptively similar from the outside.
The Specific Skills Targeted
Each worksheet in the collection focuses on one of five skill clusters that thread through K–8 Earth science:
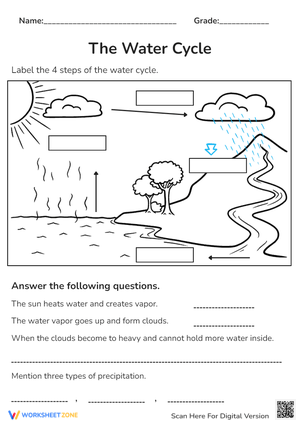
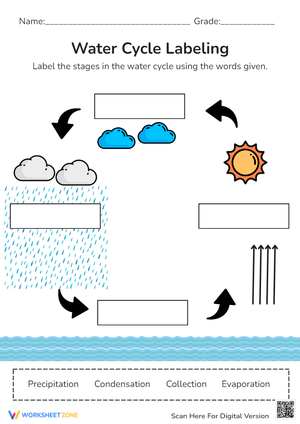
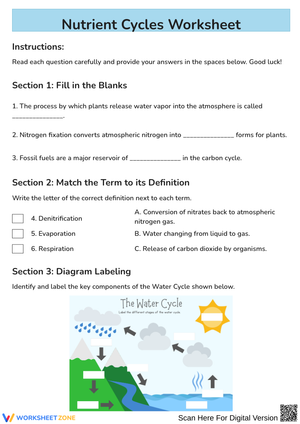
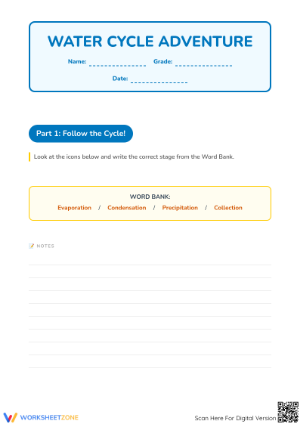
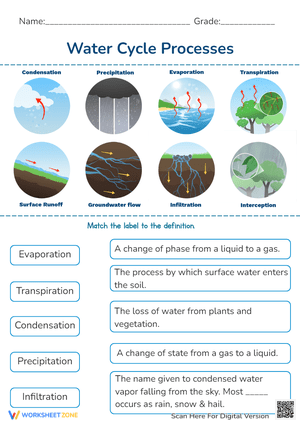
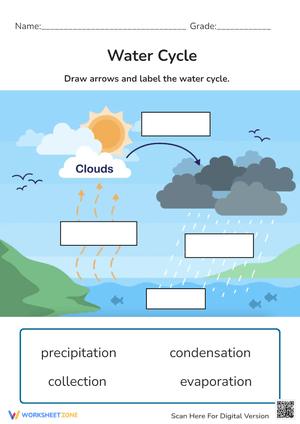
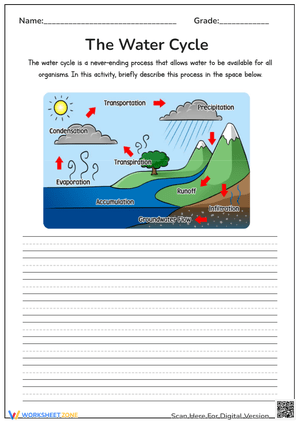
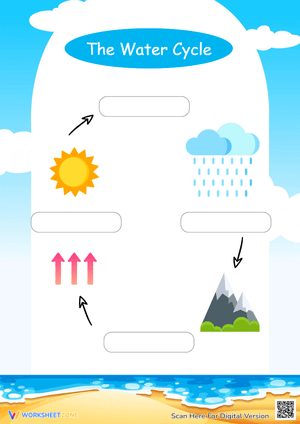
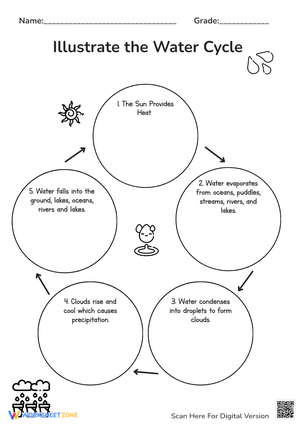
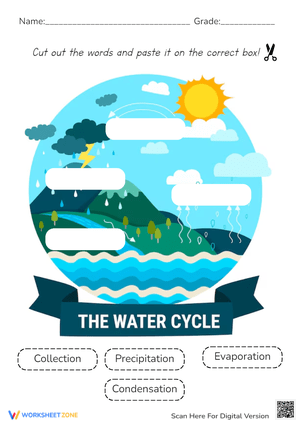
- Water cycle diagram labeling, including identifying evaporation, transpiration, condensation, precipitation, and groundwater collection as distinct stages
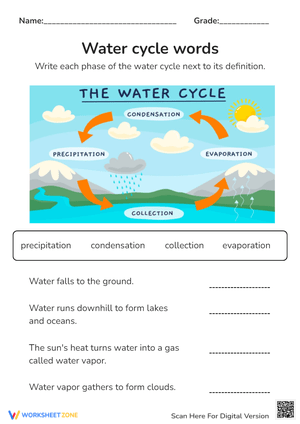
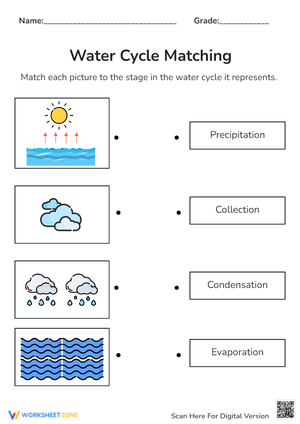
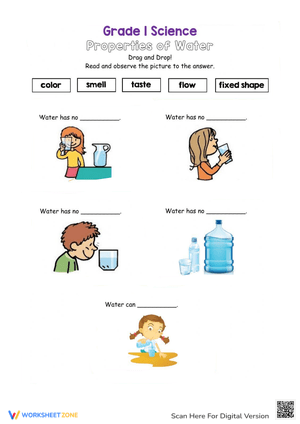
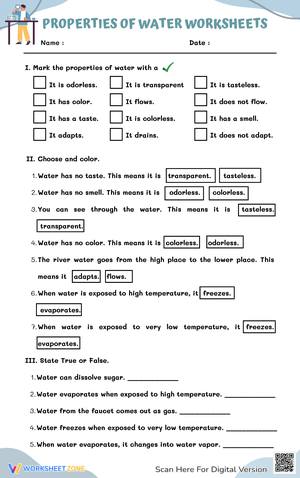
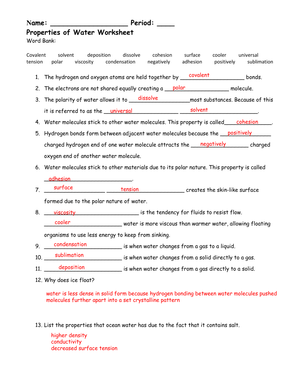
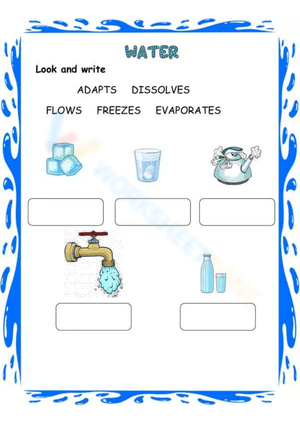
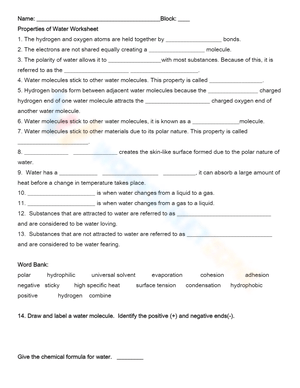
- Vocabulary matching and short-definition tasks for phase-change terminology — melting, freezing, evaporation, and condensation
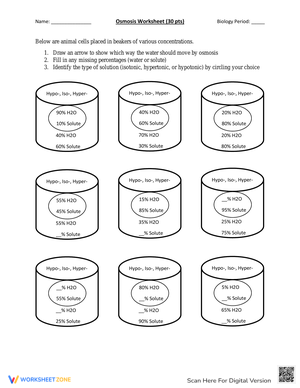
- Observation recording logs for phase-change demonstrations, asking students to note temperature, physical appearance, and state at each transition point
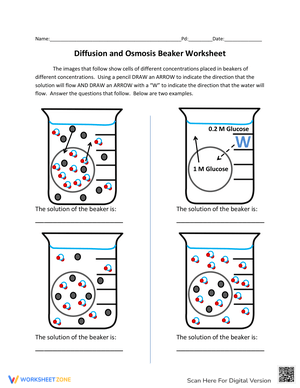
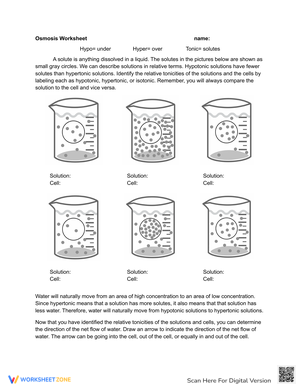
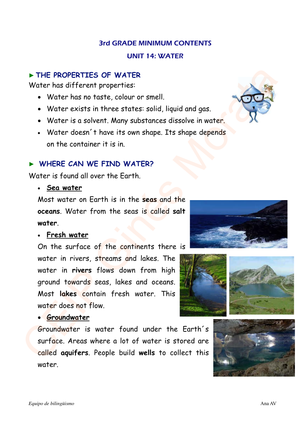
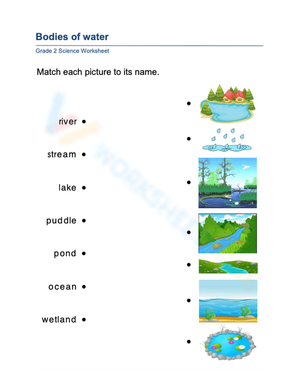
- Data interpretation tasks comparing the distribution of saltwater, freshwater, and accessible freshwater across Earth's major reservoirs
- Short-answer pollution analysis distinguishing point-source from nonpoint-source contamination and their respective effects on local watersheds
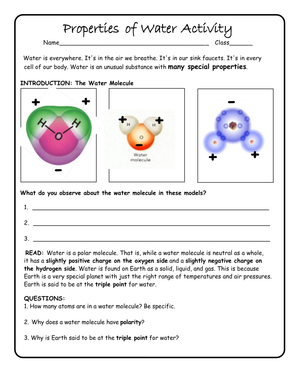
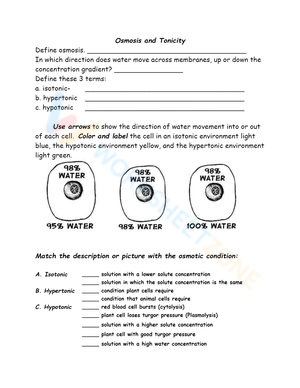
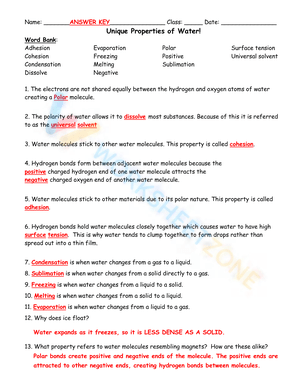
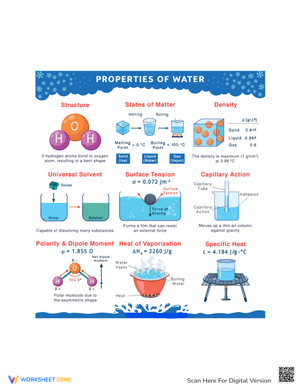
Several worksheets also ask students to draw the molecular arrangement of water in its solid, liquid, and gaseous states. That task reveals immediately whether a student understands why ice floats — its crystalline lattice is less dense than liquid water — or is simply repeating a memorized fact without the structural reasoning underneath it.
Misconceptions Worth Addressing Before the Unit Ends
The most persistent error in water cycle work is students treating evaporation and boiling as the same process. On labeling diagrams, they write "the sun boils the ocean" because their primary reference for liquid-to-gas transitions is a stovetop. The correction — that evaporation occurs at the surface at temperatures far below 100°C, driven by surface molecular energy rather than bulk heating — surfaces quickly when students must identify the energy source for each stage on the diagram. Catching it here prevents that conceptual error from calcifying across multiple units.
A second pattern appears in states-of-matter tasks. Students who correctly identify ice as a solid will still explain floating by writing "ice is lighter" rather than "ice is less dense." A second grader using "lighter" is drawing on everyday language; a fifth grader writing the same thing after a phase-change unit is carrying a conceptual gap. Conservation data tasks expose a third recurring error: students conflate "saltwater" with "dirty water" and "freshwater" with "clean water," which produces faulty conclusions on any task involving reservoir comparisons. All three errors show up in written work before they show up in class discussions, which is precisely why the worksheet record matters.
How to Work These Worksheets Into Your Weekly Lessons
In grades 2–3, the water pdf worksheets on phase changes land best immediately following a live classroom demonstration. Place an ice cube on a plate at the front of the room at the start of class and let it melt while the lesson proceeds; hand out the observation recording worksheet while the puddle is still visible. Students write their observations with a physical referent still in front of them, which reduces the abstraction load compared to describing a process recalled from memory.
In grades 4–5, the water cycle labeling worksheets function effectively as pre-assessments at the start of a unit. A student's blank or partially labeled diagram tells you more about prior knowledge than a class discussion, because you can see exactly which stages they skip or misplace. Conservation data worksheets work better near the end of a unit, once students have enough vocabulary to interpret reservoir percentages without getting stuck on terminology. For science center rotations, pair the worksheet station directly with the hands-on experiment station so the worksheet becomes the formal lab record rather than a separate activity layered on top.
Standard Alignment
Two NGSS performance expectations anchor these water pdf worksheets. 2-ESS2-3 requires second graders to identify where water is found on Earth and whether it appears as solid or liquid — a standard students often satisfy superficially without grasping that most of Earth's freshwater sits locked in glaciers and ice caps, inaccessible for human use. The categorization and labeling worksheets here push students past surface identification toward comparative thinking about state, location, and availability simultaneously.
5-ESS2-2 asks fifth graders to describe and graph the distribution of water across Earth's major reservoirs. The data interpretation tasks in this set give students repeated practice reading and constructing those representations before the skill appears in a formal assessment context. The two standards are sequenced deliberately in the NGSS framework: second grade builds observational and categorical vocabulary; fifth grade applies quantitative reasoning to the same substance. These worksheets sit at both points in that progression.
Differentiating the Set Across Student Readiness Levels
For students still building science vocabulary, the open labeling tasks can be restructured as directed word-bank activities — supply the eight water cycle terms and ask students to place them correctly on the diagram. This shifts cognitive demand from recall to recognition without lowering the conceptual target. Students who freeze on blank-label versions typically succeed with the word bank, and their placements still reveal whether they understand the sequence of stages well enough to distinguish condensation from precipitation.
Students who move through the material quickly benefit most from open-ended extensions in the data analysis worksheets. After completing the freshwater distribution chart, ask them to calculate the percentage of Earth's total water that humans can actually access — approximately 0.3% — and explain in writing what that figure means for long-term conservation. That extension requires no additional printed material; it is a margin prompt. The molecular-structure drawing tasks also differentiate naturally: most students sketch rough circles representing each state, but students with stronger prior knowledge will attempt hydrogen bond notation unprompted, which creates an organic entry point for deeper discussion rather than a correction moment.
Frequently Asked Questions
What grade levels do these worksheets cover?
The set spans K–8. Simpler identification, sorting, and sequencing tasks target primary grades; data analysis, pollution scenarios, and molecular-structure work are aimed at grades 4–5 and above. Most water pdf worksheets in this collection include a grade-range indicator, so teachers can sort by level quickly without reading every task in full.
Do the PDFs include answer keys?
Yes. Each worksheet includes a complete teacher answer key. For labeling diagrams and vocabulary tasks, the key lists accepted responses; for data interpretation tasks, it includes the calculated values and brief notes on common wrong answers, so teachers can anticipate what to address during the debrief rather than discovering the errors after papers are returned.
How do I use these for the water cycle specifically?
Use the cycle labeling diagram as a pre-assessment before instruction begins, then return to the same diagram format — with different placement prompts — as a post-assessment after the unit closes. Students who see their own progression from a partially labeled diagram to a fully annotated one have a concrete record of what they learned. Pair the vocabulary matching worksheet with the labeling task on the same day to build both declarative knowledge and applied sequencing of cycle terminology in one sitting.
Are there worksheets focused on conservation and environmental impact?
Several worksheets address conservation directly, including data-tracking tasks where students compare per-capita water use across countries and a reading-based activity analyzing a local watershed scenario. These work best as culminating activities near the end of an environmental science unit, after students have built the foundational vocabulary from earlier in the sequence — otherwise the data-heavy format tends to slow down students who are still learning the terminology rather than applying it.