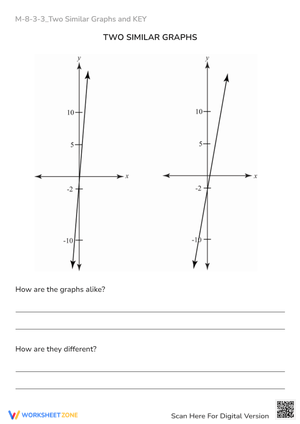
When a student can find the slope of a table but freezes at a graph of the same relationship, the gap is not about functions in general. It is about moving between representations. Comparing functions worksheets are built to close exactly that gap, giving students two functions shown in different formats and asking them to judge which has the greater rate of change or which starts at a higher value.
This work sits squarely inside CCSS.MATH.CONTENT.8.F.A.2, which requires students to compare properties of two functions each represented in a different way: algebraically, graphically, numerically in tables, or through verbal description. For an algebra intervention teacher or a core Grade 8 math teacher, that standard is not optional practice. It is the checkpoint that determines whether students can carry rate-of-change thinking into systems of equations and function transformations in high school.
What the Standard Asks Students to Do
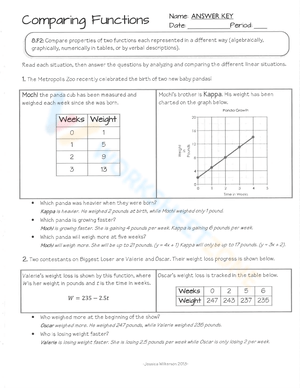
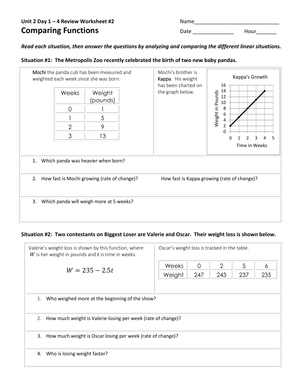
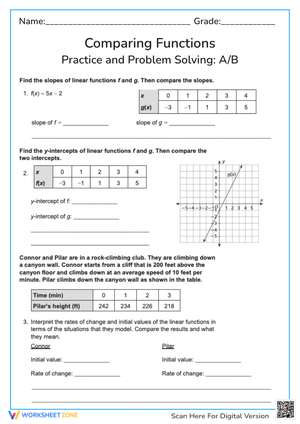
The classic example behind 8.F.A.2 is simple to describe and harder to execute: give students a linear function as a table of x and y values, and a second linear function as an equation such as y equals 3x plus 2. Students must determine which function has the greater rate of change. That single task hides several sub-skills. Students need to recognize slope inside a table by finding the change in y over the change in x, recognize slope as the coefficient in an equation, and then compare the two numbers meaningfully.
The reason this standard trips up so many otherwise capable Grade 8 students is that each representation hides the rate of change differently. In a table, it is buried in the pattern between rows. In a graph, it is the steepness between two plotted points. In an equation, it is a visible coefficient. In a word problem, it is often described only in language, such as a cost that increases by a fixed amount per unit. A worksheet that mixes these four formats forces students to build a flexible, transferable definition of rate of change instead of memorizing one procedure tied to one format.
Choosing the Right Mix of Representations
Not every comparing functions worksheet needs all four representations at once. For most classrooms, the most useful sequence starts narrow and widens gradually.
- Table versus table, to confirm students can compute rate of change consistently from raw data.
- Table versus graph, since students often struggle to translate a visual slope into a numeric one.
- Equation versus verbal description, which tests whether students can extract slope and initial value from a real-world scenario.
- All four representations mixed, once the first three pairings are solid, to mirror how the standard will actually appear on assessments.
This progression matters because jumping straight to a fully mixed worksheet can mask which specific representation is the weak link for a given student.
Using Comparing Functions Worksheets for Formative Assessment
Because 8.F.A.2 requires comparison rather than isolated computation, these worksheets double as diagnostic tools. A well-designed item does not just ask which function has the greater rate of change. It asks students to justify the comparison in writing, which reveals whether they understand rate of change as a concept or are only pattern-matching numbers. Exit tickets built from a single comparison pair, one table and one graph, give a fast read on whether a class is ready to move forward or needs another day on extraction skills before comparison skills.
Classroom Implementation
In a whole-class setting, partner comparison tasks work well because they require students to articulate their reasoning out loud. One partner defends why Function A has the greater rate of change, the other checks the claim against the given representation, and both partners record their agreed answer along with the evidence. Error analysis tasks are another strong option: present a comparison where the rate of change was calculated correctly but the initial value was confused with the rate of change, and ask students to identify and correct the error. This directly targets one of the most common mistakes on 8.F.A.2 items. Teachers can also rotate comparing functions worksheets into weekly review cycles so the skill stays active heading into unit assessments on linear modeling under 8.F.B.4 and 8.F.B.5.
Frequently Asked Questions
1. What grade level and standard do comparing functions worksheets target?
These worksheets are built for Grade 8 math and align to CCSS.MATH.CONTENT.8.F.A.2, which asks students to compare properties of two functions each shown in a different representation.
2. What representations should a comparing functions worksheet include?
A strong worksheet includes functions shown algebraically, graphically, numerically in a table, and through a verbal description, since 8.F.A.2 explicitly names all four formats.
3. How can teachers use these worksheets for small-group intervention or review?
Isolate one representation pair at a time, such as table versus graph, and repeat that pairing until students show consistent accuracy before introducing all four formats together.
4. What is a common student mistake when comparing functions across formats?
Students frequently confuse rate of change with initial value, particularly when a table does not start at zero or a graph does not pass through the origin.
5. How do comparing functions worksheets prepare students for later algebra content?
The skill of comparing functions across representations builds directly toward high school work on systems of equations and function transformations, both of which require students to extract and compare slope and initial value quickly.