


























Views
Downloads

Grade 8 Linear Graphs — Printable No-Prep Worksheet
Paste this activity's link or code into your existing LMS (Google Classroom, Canvas, Teams, Schoology, Moodle, etc.).
Students can open and work on the activity right away, with no student login required.
You'll still be able to track student progress and results from your teacher account.
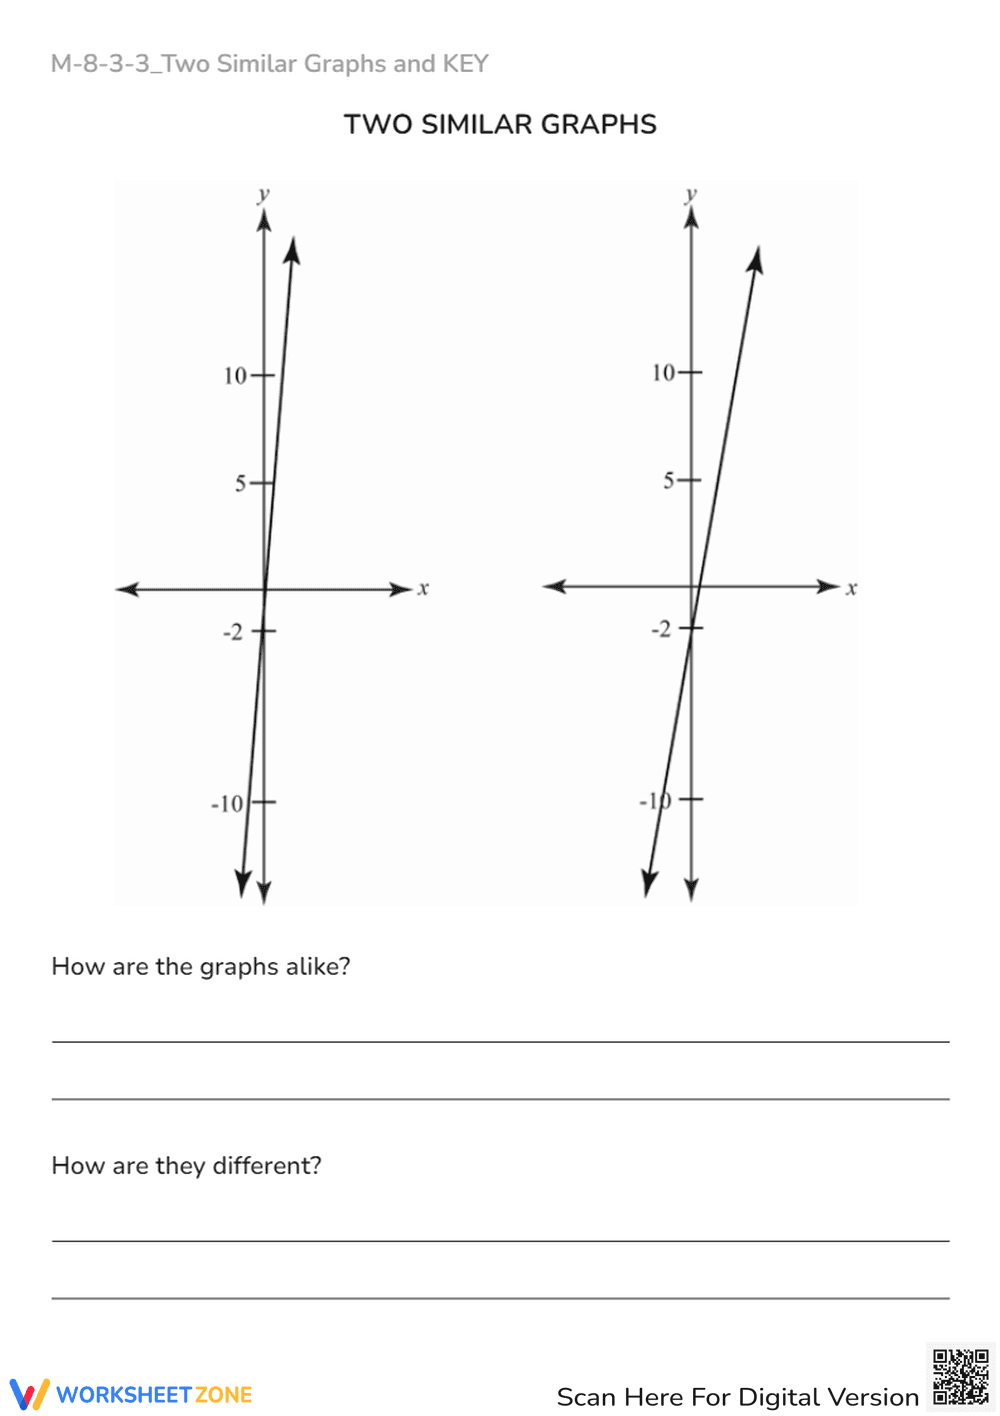
This Grade 8 math worksheet helps students analyze and compare linear functions by examining two similar graphs. Students identify key features like slope and y-intercept to explain similarities and differences. This activity strengthens conceptual understanding of linear relationships.
At a Glance
- Grade: Grade 8 · Subject: Math
- Standard:
CCSS.MATH.CONTENT.8.F.A.2— Compare properties of two functions represented graphically- Skill Focus: Comparing slope and y-intercept of linear graphs
- Format: 2 pages · 2 problems · Answer key included · PDF
- Best For: Quick formative assessment, homework, or math warm-up
- Time: 10–15 minutes
The worksheet features two side-by-side coordinate planes displaying distinct linear graphs. Below the visual models, students encounter two open-ended prompts requiring written explanations of how the graphs are alike and how they differ. A complete answer key is provided.
Zero-Prep Workflow
This resource requires less than 2 minutes of total teacher preparation time. Follow these three steps to integrate it:
- Print (1 minute): Print the single-page student worksheet. The second page contains the answer key.
- Distribute (30 seconds): Hand out the sheets or upload the PDF to your LMS.
- Review (15 seconds): Use the answer key to quickly grade student responses.
This layout makes the worksheet an excellent option for emergency sub plans.
Standards Alignment
This activity aligns with `CCSS.MATH.CONTENT.8.F.A.2`, which requires comparing properties of two functions represented graphically. It also supports `CCSS.MATH.CONTENT.8.F.B.4` by prompting students to analyze rate of change. Both standard codes can be copied directly into lesson plans, IEP goals, or curriculum mapping tools.
How to Use It
Use this worksheet as a warm-up after direct instruction on slope. Have students work individually for 10 minutes to analyze the graphs. Walk around and observe if students correctly identify the y-intercepts. Alternatively, assign it as an exit ticket to gauge student mastery of linear functions.
Who It's For
This resource is designed for eighth-grade math students learning algebra. It provides scaffolding for struggling learners by focusing on visual comparison. Pair this worksheet with a guided lesson on graphing linear equations to reinforce the concepts of slope and vertical translation.
Research by Fisher & Frey (2014) highlights the importance of visual representations in developing algebraic reasoning. When students compare two similar graphs, they engage in contrastive analysis, which helps them isolate key variables like slope and y-intercept. This worksheet targets `CCSS.MATH.CONTENT.8.F.A.2` by prompting students to articulate these differences in writing. According to educational research, explaining mathematical concepts in writing solidifies conceptual understanding and improves retention. By focusing on the visual differences between two linear functions, students build a stronger foundation for interpreting rate of change and initial value in real-world contexts. This structured approach ensures that learners do not just memorize formulas but actually understand the graphical behavior of linear equations. Teachers can confidently integrate this tool to support diverse learners, ensuring alignment with evidence-based practices for middle school mathematics instruction.


