


























Views
Downloads

Essential Restricted Domain Function Graphing Worksheet
Paste this activity's link or code into your existing LMS (Google Classroom, Canvas, Teams, Schoology, Moodle, etc.).
Students can open and work on the activity right away, with no student login required.
You'll still be able to track student progress and results from your teacher account.
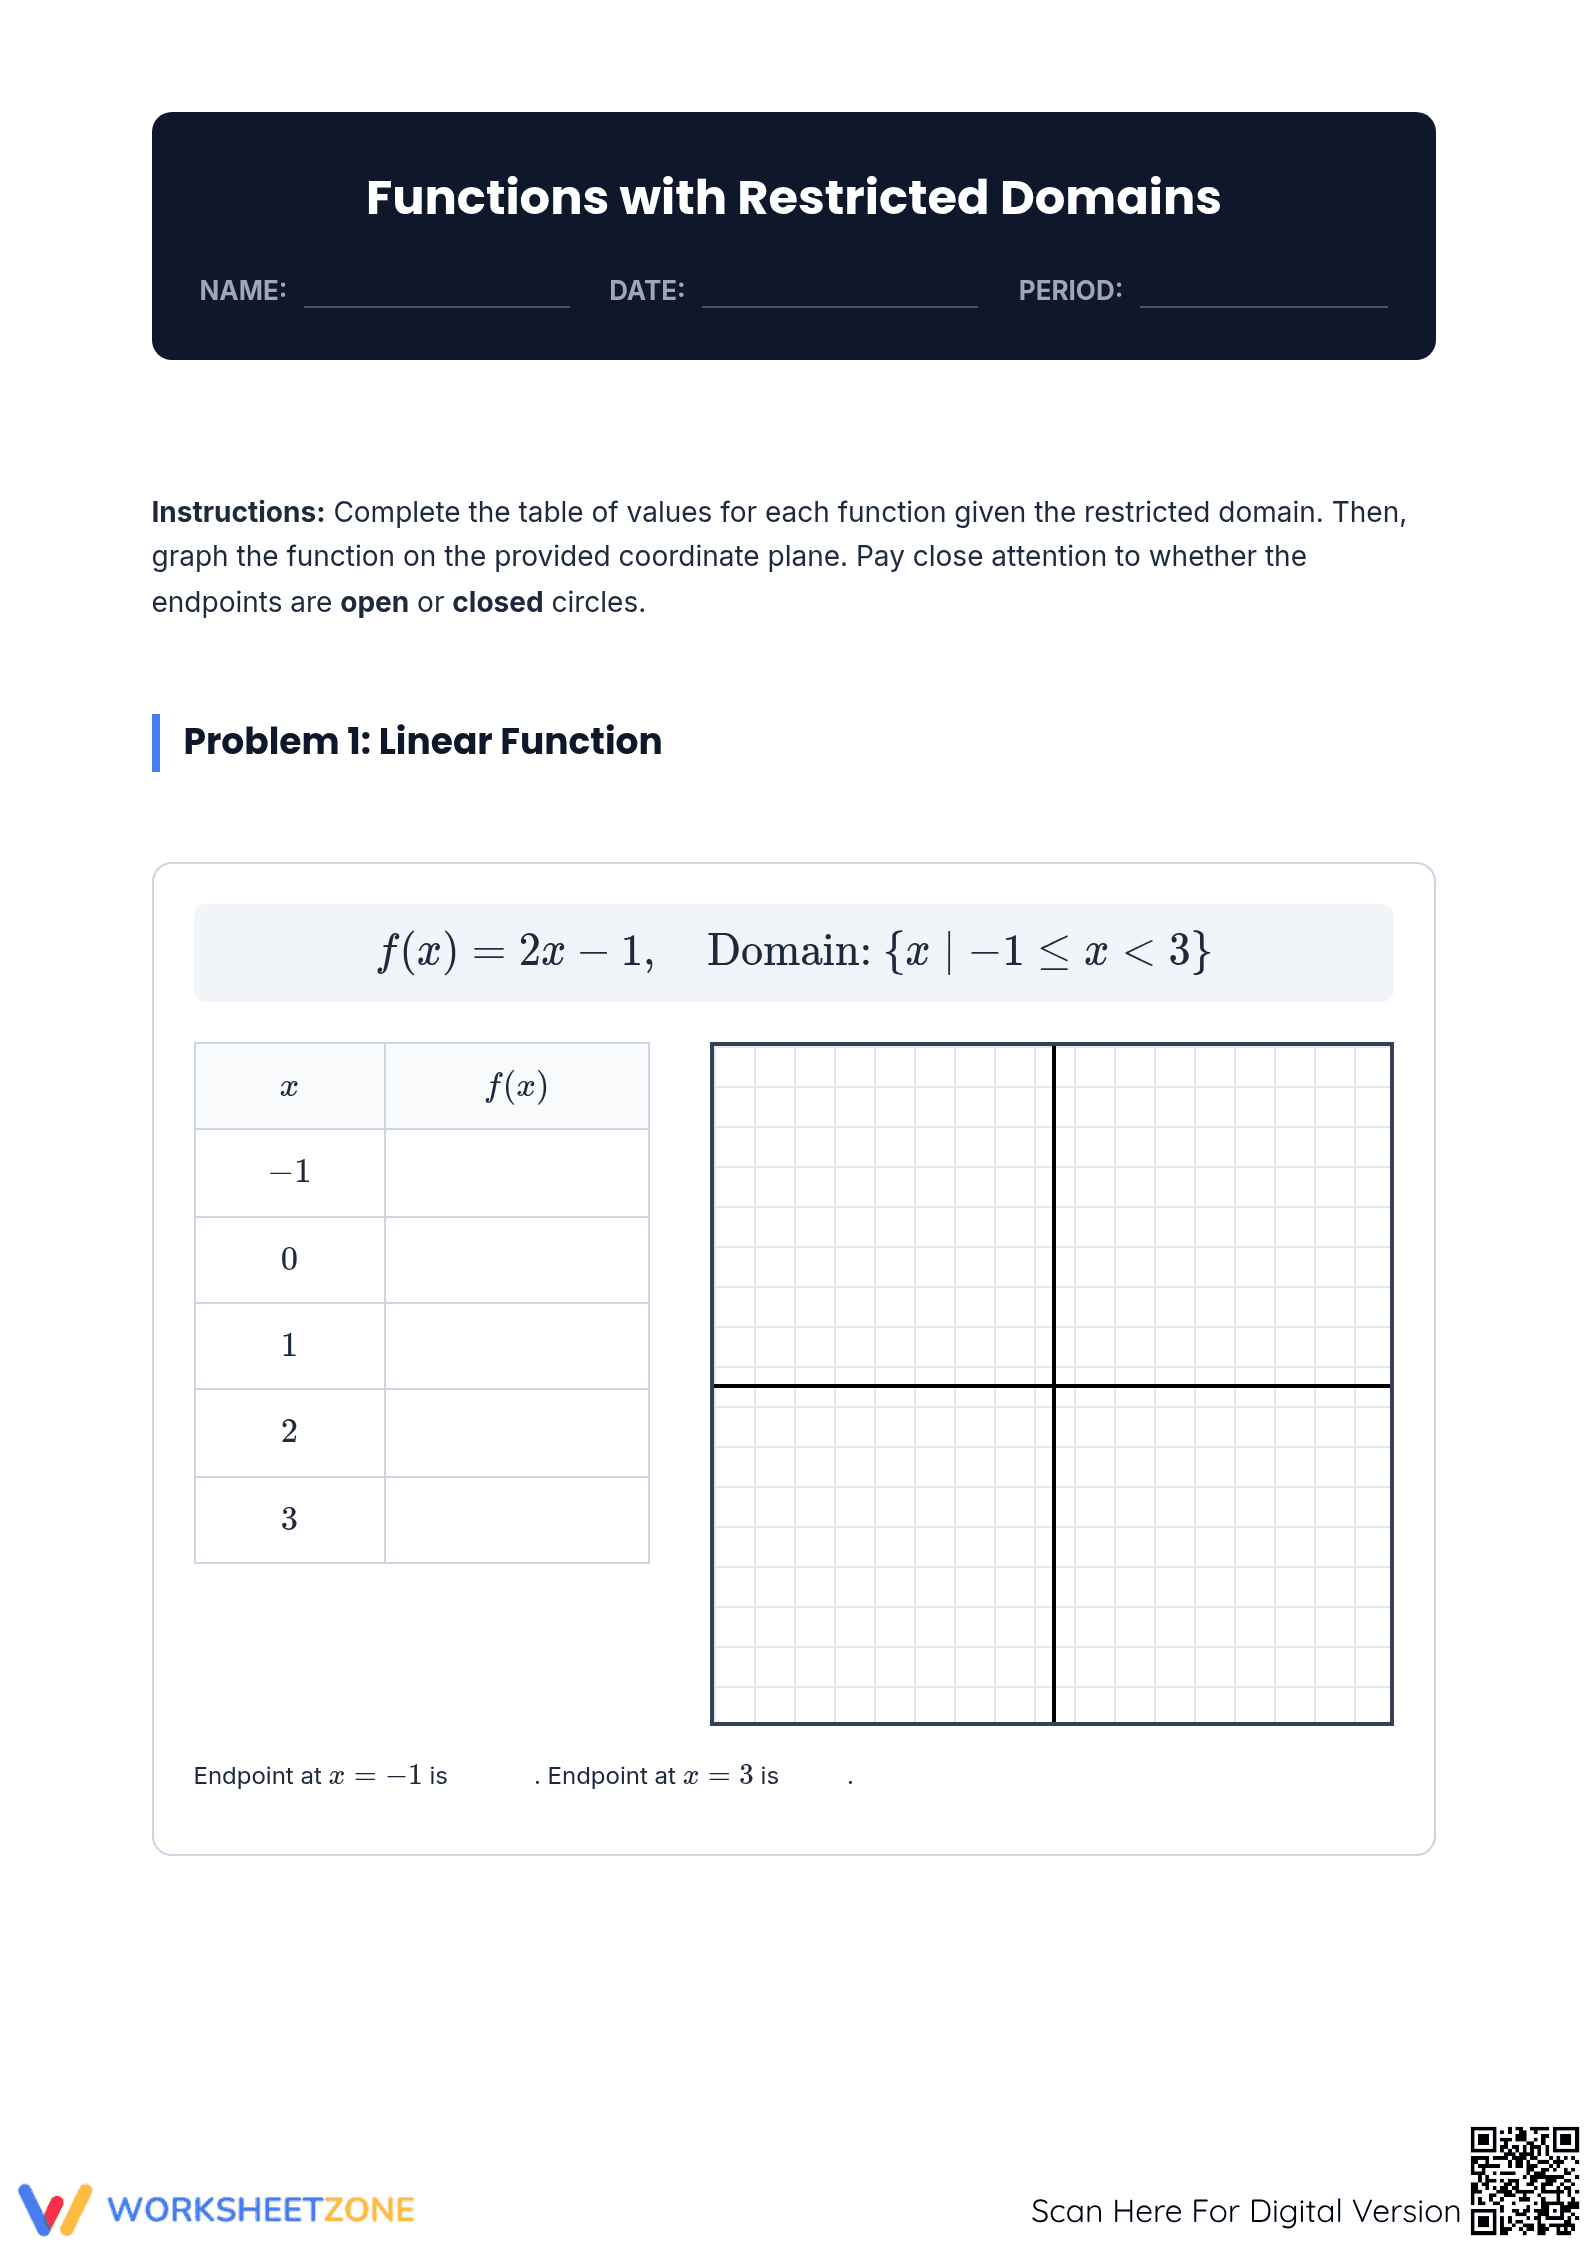
This worksheet provides comprehensive practice for students mastering functions with restricted domains. By requiring both table completion and precise coordinate graphing, it ensures learners understand how constraints affect a function's visual representation. Students will navigate linear and absolute value equations, identifying critical open and closed endpoints to produce accurate mathematical models of constrained relationships.
At a Glance
- Grade: 9–12 · Subject: Math
- Standard:
HSF.IF.C.7.B— Graph absolute value and piecewise-defined functions by identifying key features and applying domain constraints- Skill Focus: Coordinate graphing with restricted domains
- Format: 2 pages · 5 problems · Answer key included · Printable PDF
- Best For: High school algebra students practicing function transformations and constraints
- Time: 20–30 minutes
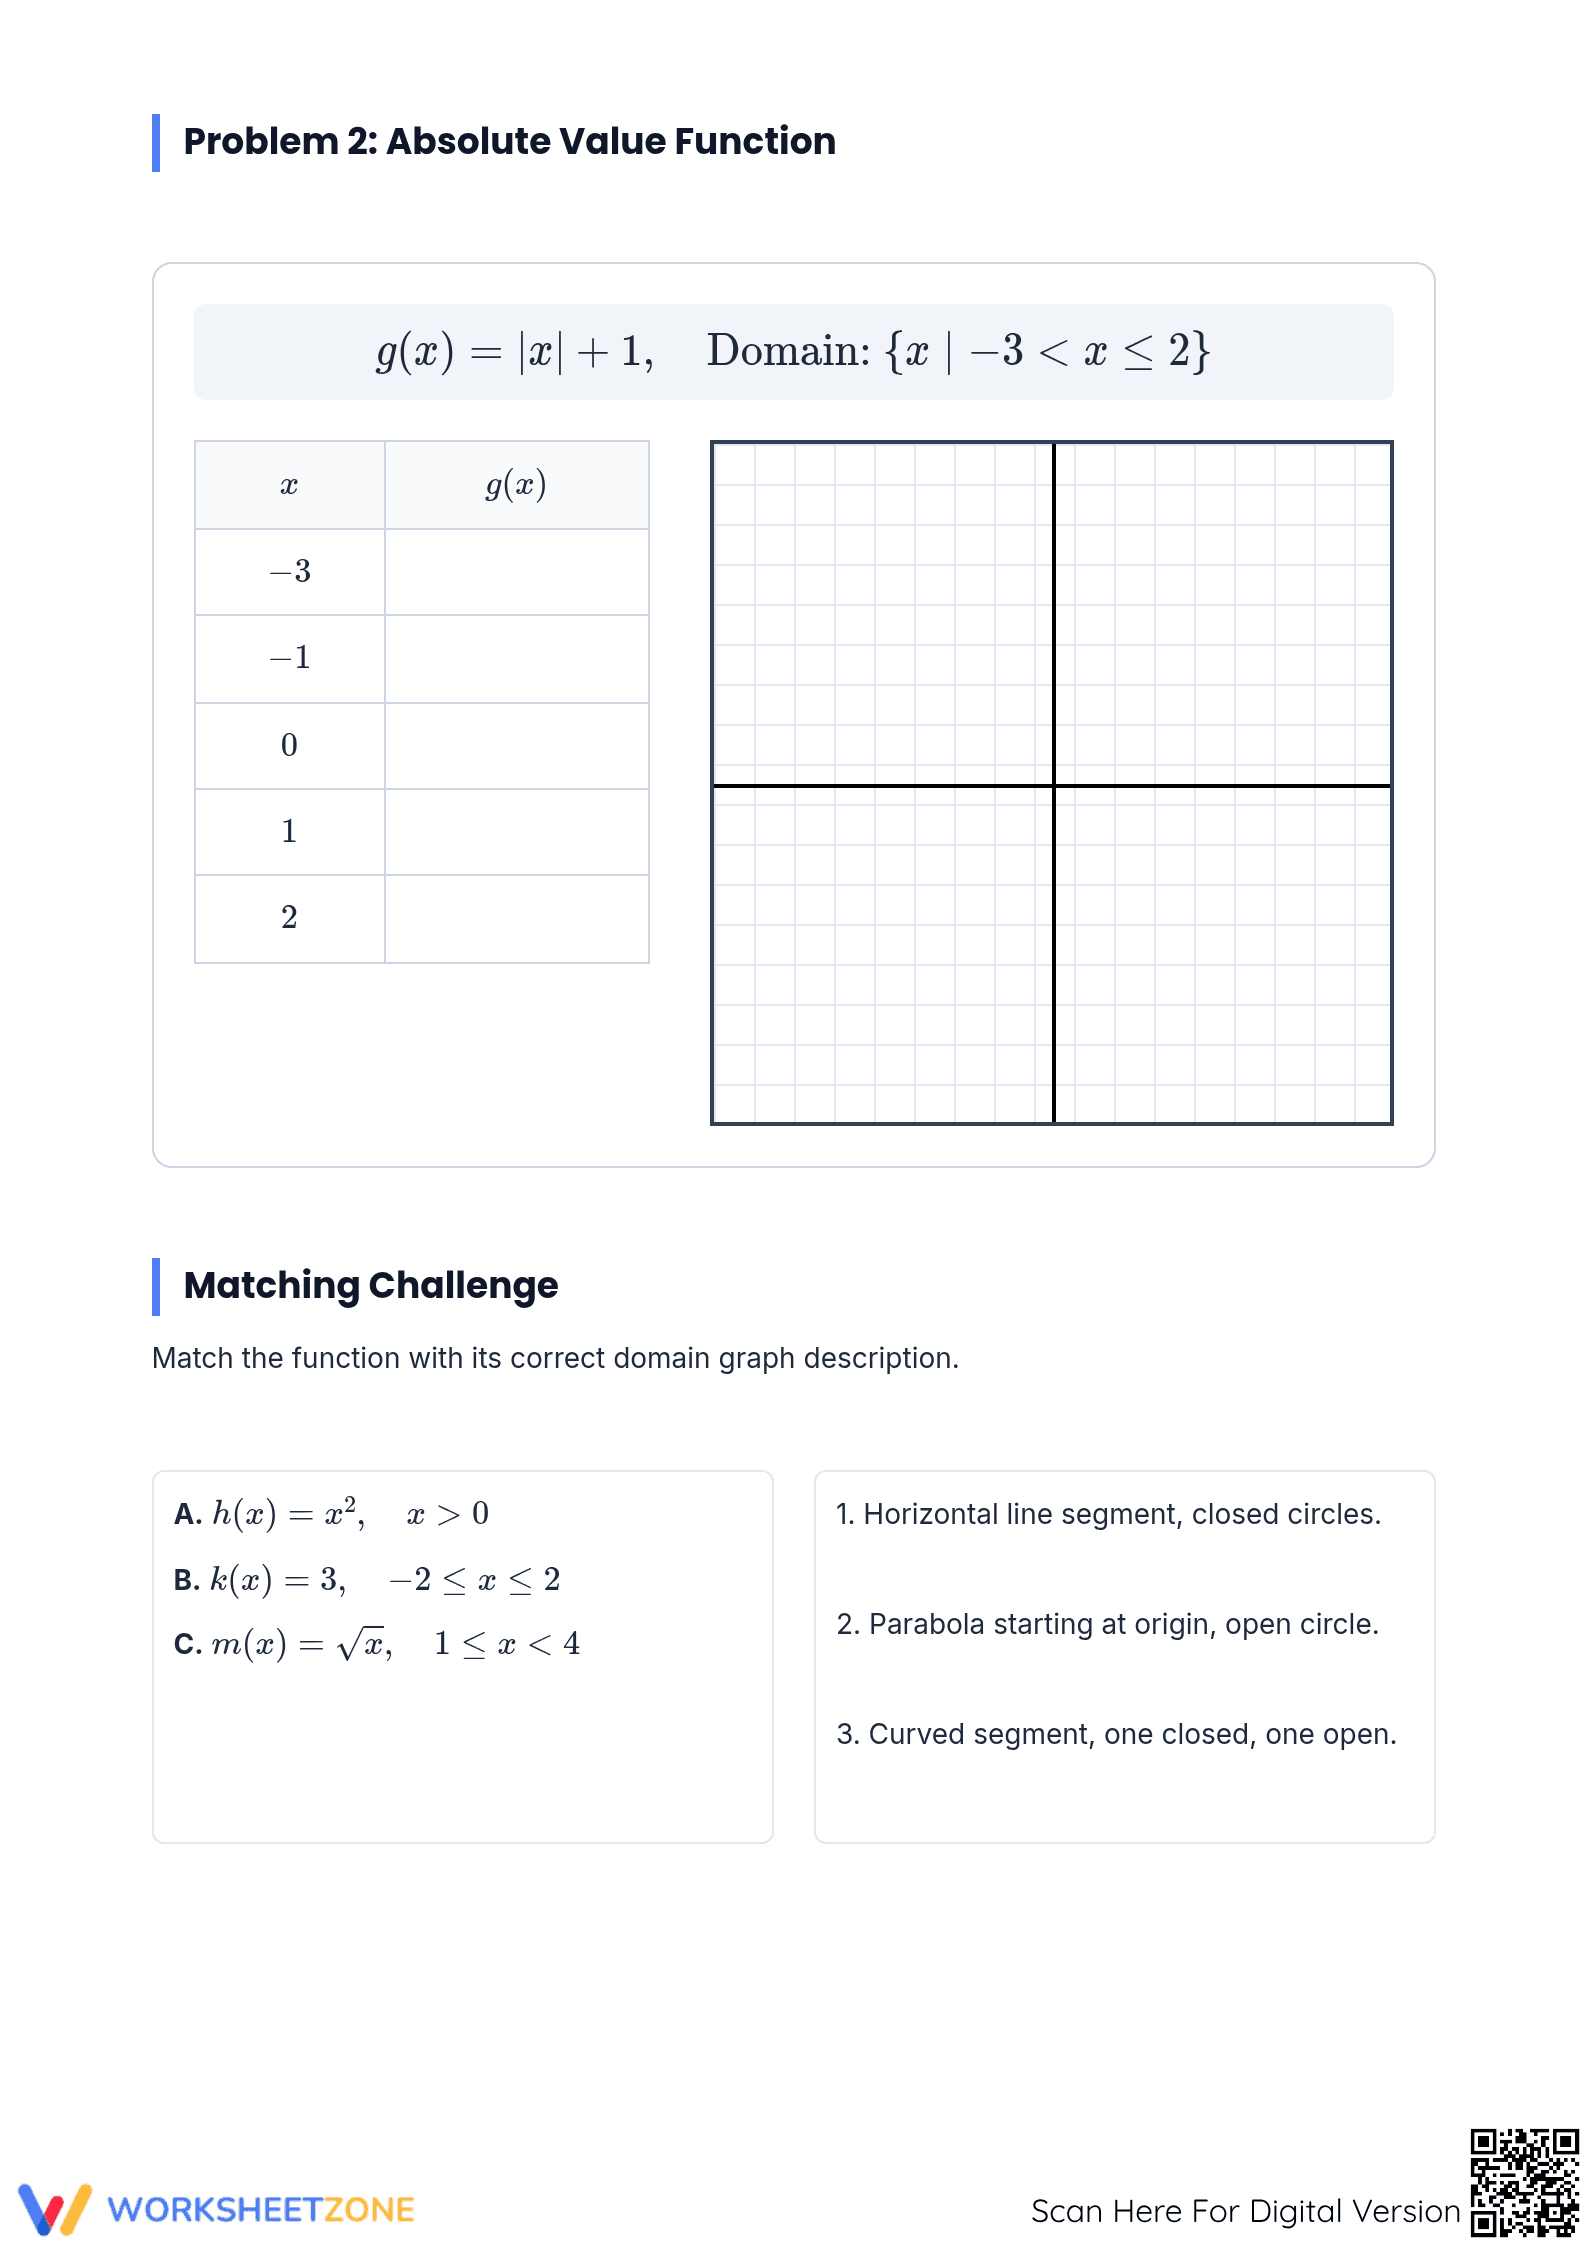
The two-page PDF contains two primary graphing problems requiring students to fill in an input-output table before plotting points. It specifically targets the visual distinction between inclusive and non-inclusive endpoints (open vs. closed circles). Additionally, a Matching Challenge on the second page tests conceptual understanding by pairing equations like h(x) = x² and m(x) = √x with their verbal domain descriptions.
Skill Progression
- Guided practice: The first problem provides a linear function f(x) = 2x - 1 with a five-row table to scaffold the transition from algebraic evaluation to coordinate plotting.
- Supported practice: The second task increases complexity with an absolute value function g(x) = |x| + 1, requiring students to recognize symmetry and V-shape characteristics within specific bounds.
- Independent practice: The final Matching Challenge moves toward abstract reasoning, asking students to visualize horizontal line segments and parabolas without the aid of a pre-filled table.
The sequence follows a gradual-release model, moving from structured calculation to high-level pattern recognition.
Standards Alignment
The worksheet is primarily aligned with HSF.IF.C.7.B: "Graph square root, cube root, and piecewise-defined functions, including step functions and absolute value functions." It also supports HSF.IF.B.4 by asking students to interpret key features of graphs and tables in context. Both standard codes can be copied directly into lesson plans, IEP goals, or district curriculum mapping tools.
How to Use It
Use this as a mid-lesson check during direct instruction on piecewise functions or as a standalone homework assignment. For a formative assessment tip, observe whether students correctly identify the open circle at the endpoint where x < 3 in Problem 1. This reveals their grasp of inequality notation in a graphical context. Most students complete the full set in 25 minutes.
Who It's For
Designed for Grade 9-12 Algebra 1, Algebra 2, or Pre-Calculus students, this resource is ideal for learners who need concrete steps to visualize domain restrictions. It pairs naturally with an anchor chart on interval notation or a teacher-led demonstration of piecewise function graphing on a digital whiteboard.
Effective instruction in function transformations and domain constraints requires multiple representations, moving from numerical tables to graphical models. According to RAND AIRS 2024, utilizing structured scaffolds like the tables provided in this resource helps bridge the gap between abstract symbolic manipulation and visual interpretation for secondary mathematics students. This worksheet specifically addresses the cognitive load associated with restricted domains by isolating the variable evaluation step before graphing begins. By incorporating standard HSF.IF.C.7.B, educators can ensure their curriculum aligns with national benchmarks for mathematical modeling. The inclusion of matching tasks further reinforces the linguistic connection between mathematical notation and geometric shapes like parabolas and line segments. This dual-coded approach is recognized by ScienceDirect TpT Analysis as a high-impact strategy for increasing student retention of complex algebraic concepts.


