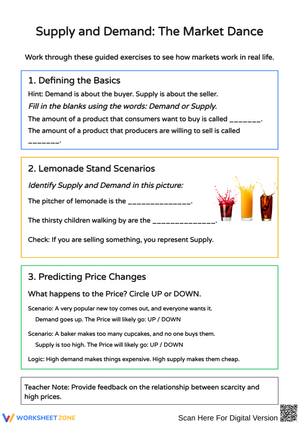
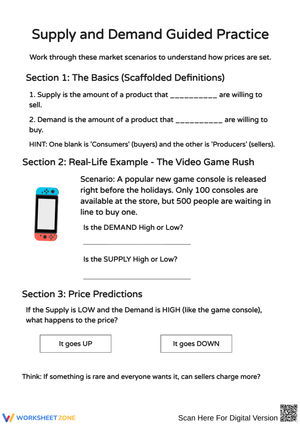
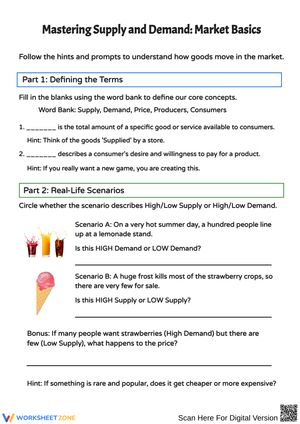
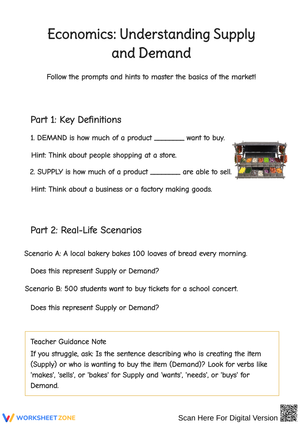
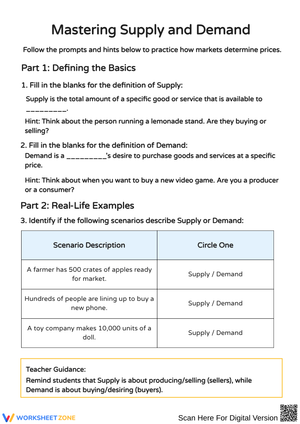
These 7th grade economics supply and demand worksheets give social studies teachers a set of focused, printable resources for building market literacy during an economics unit — covering vocabulary, curve reading, equilibrium identification, and scenario reasoning without pushing students into the kind of abstract math that belongs in a later course.
What's Inside the Set
Each worksheet targets a distinct layer of supply and demand understanding. Students start with producer and consumer vocabulary — supply, demand, equilibrium, shortage, surplus — and then move into graph work where they label price and quantity axes, locate equilibrium, and identify what happens when price sits above or below that point. Scenario worksheets present brief real-world situations: a clothing trend spikes demand, a supply chain disruption reduces quantity available, a seasonal shift drops consumer interest. Students decide which curve moved, sketch the result, and write a sentence explaining the outcome.
The set also includes questions that isolate the distinction between movement along a curve and a shift of the entire curve — a conceptual line that trips up most 7th graders the first time through. Worksheets on this skill ask students to sort a list of events into "movement along" or "shift," then justify their sorting in plain language.
Frequent Student Errors Worth Watching For
The most consistent error pattern involves surplus and shortage labels. Students who can correctly identify equilibrium will still reverse the two conditions — marking a surplus when price falls below equilibrium, and a shortage when it rises above. The confusion is almost always a memorization shortcut gone wrong: they remember the word "shortage" and associate it with "something being wrong with prices" without connecting it specifically to excess demand at a low price. Worksheets that require students to write out the logic — At this price, buyers want 80 units but sellers offer only 50, so this is a shortage — catch and correct this far more reliably than multiple-choice formats alone.
A second error appears when students try to explain curve shifts. A student who can identify that a drought reduces the supply of oranges will often still draw the supply curve shifting right instead of left, because "less supply" intuitively feels like a smaller number rather than a leftward position. Building in a brief labeling step — Label the original curve S1 and the new curve S2, then circle whether quantity supplied increased or decreased at the same price — makes the direction of movement explicit before students interpret it.
Lesson-Planning Strategies to Get the Most From These Worksheets
The vocabulary worksheet makes the strongest bell ringer during the first two days of an economics unit — seven minutes at the start of class covers the terms students will need before any graph work begins. The graph-reading worksheet fits a guided practice slot right after direct instruction: model one question, release students to a second with a partner, and use their answers on the third to gauge who needs reteaching before the next day.
Scenario worksheets work well on Fridays when the week's concepts are fresh but attention spans are shorter. Students read the prompt, sketch the shift, and write one sentence — total time is about twelve minutes, which leaves room for a brief whole-class debrief before dismissal.
For sub plans, the equilibrium worksheet is the most self-contained: directions are plain, answer spaces are structured, and students don't need background beyond a definition sheet to get through it. Keep the answer key in your sub folder and it checks in under five minutes.
Adapting the Worksheets Across Ability Levels
Students who are still building reading fluency or working with vocabulary-heavy content benefit from using only the definition and matching sections before attempting any graph work. For those students, separating the vocabulary worksheet entirely from the curve-reading worksheet removes the cognitive pressure of dealing with both symbol and language demands at once.
Students who finish quickly and need extension can be asked to write their own market scenario — one where supply shifts and one where demand shifts — and then trade with a partner to analyze. That task uses the same skills the worksheet targets but requires generative thinking rather than guided application. The scenario worksheets in the set include a blank template for exactly this purpose.
One honest limitation: the format can frustrate students who read slowly but reason well. The scenario items require enough text processing that some students never get to the economics reasoning behind them. For those students, reading the scenario aloud and allowing a verbal response captures understanding the worksheet alone would miss.
Frequently Asked Questions
Do these worksheets require any prior economics instruction, or can students work through them cold?
The vocabulary worksheet works well as an introduction, but the graph-reading and scenario worksheets are stronger after students have seen at least one curve drawn and explained. A ten-minute direct instruction segment before assigning those worksheets makes a noticeable difference in completion quality.
Can I use individual worksheets from the set without assigning all of them?
Yes. Each worksheet is standalone. The vocabulary worksheet, the equilibrium graph worksheet, and the shift-versus-movement worksheet each cover a distinct skill and assign well independently. There's no required sequence, though the order described above reflects what tends to work best instructionally.
Are the graphs simple enough for students who struggle with visual-spatial tasks?
The graphs use two clearly labeled axes, two lines (one supply, one demand), and a marked equilibrium point. There's no gridded scaling or plotted data — students are reading and labeling rather than constructing from scratch. Most students who find graph work difficult in math do fine with these because the task is interpretive rather than computational.












 Interactive Worksheet Maker
 Quiz Maker
 Word Search Maker
 Crossword Puzzle Maker
 Word Scramble Generator
 Sentence Scramble Generator
 Handwriting Worksheet Generator
 Name Tracing Generator
 Fill In The Blank Generator