


Views
Downloads

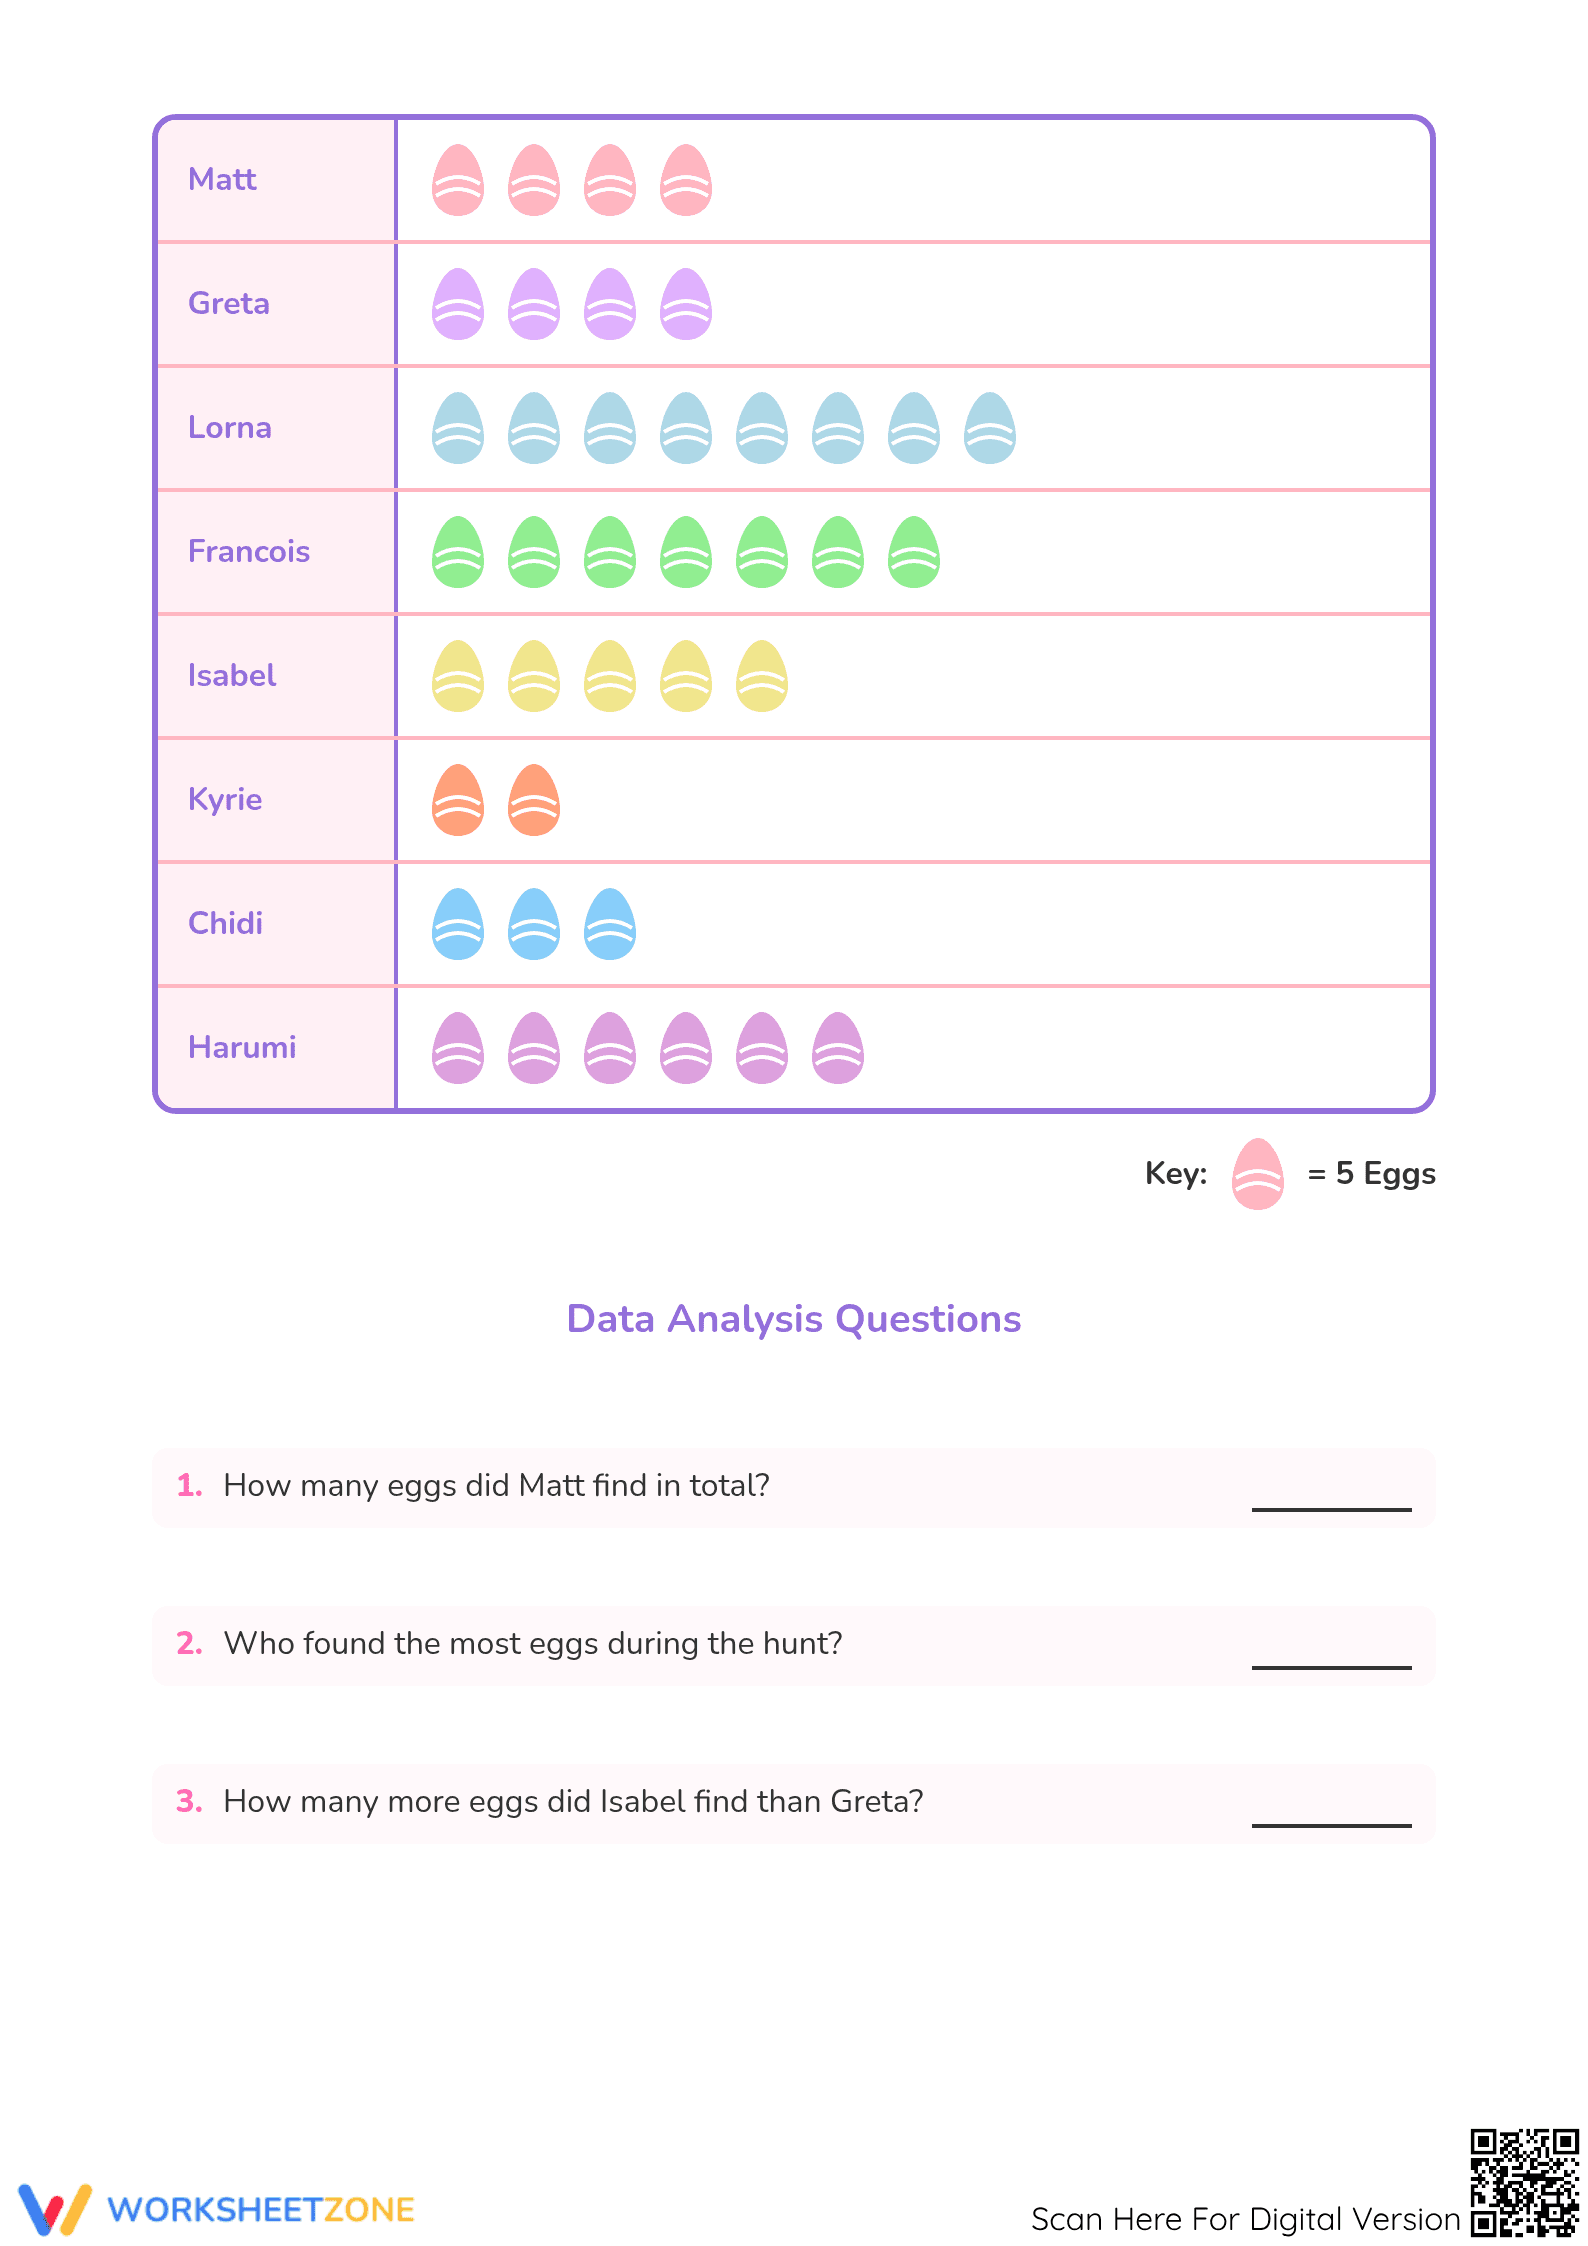
Printable Easter Pictograph Math Worksheet | Grade 3 Data
Paste this activity's link or code into your existing LMS (Google Classroom, Canvas, Teams, Schoology, Moodle, etc.).
Students can open and work on the activity right away, with no student login required.
You'll still be able to track student progress and results from your teacher account.
This Easter pictograph worksheet helps third-grade students master data interpretation through a festive egg hunt theme. By analyzing a scaled graph where each symbol represents five units, learners build critical multiplication and comparison skills. It transforms abstract data analysis into an engaging challenge that provides immediate evidence of student mastery.
At a Glance
- Grade: 3 · Subject: Mathematics
- Standard:
CCSS.MATH.CONTENT.3.MD.B.3— Solve one- and two-step problems using information presented in scaled picture graphs- Skill Focus: Interpreting Scaled Pictographs
- Format: 3 pages · 8 problems · Answer key included · PDF
- Best For: Holiday-themed data analysis practice
- Time: 20–30 minutes
This three-page resource features a comprehensive "Easter Egg Hunt" pictograph, accompanied by a dedicated notes section for student scratch work. The activity includes eight targeted data analysis questions, ranging from simple retrieval to multi-step logic. A complete answer key is provided to facilitate quick grading and self-correction for both teachers and students.
Skill Progression
- Guided Practice: Initial tasks focus on direct data retrieval and single-step multiplication using the 5-unit scale. Students determine totals for specific individuals and perform basic "how many more" comparisons.
- Supported Practice: Mid-range problems require students to compare multiple data categories simultaneously to identify matching values and calculate differences between non-adjacent categories on the graph.
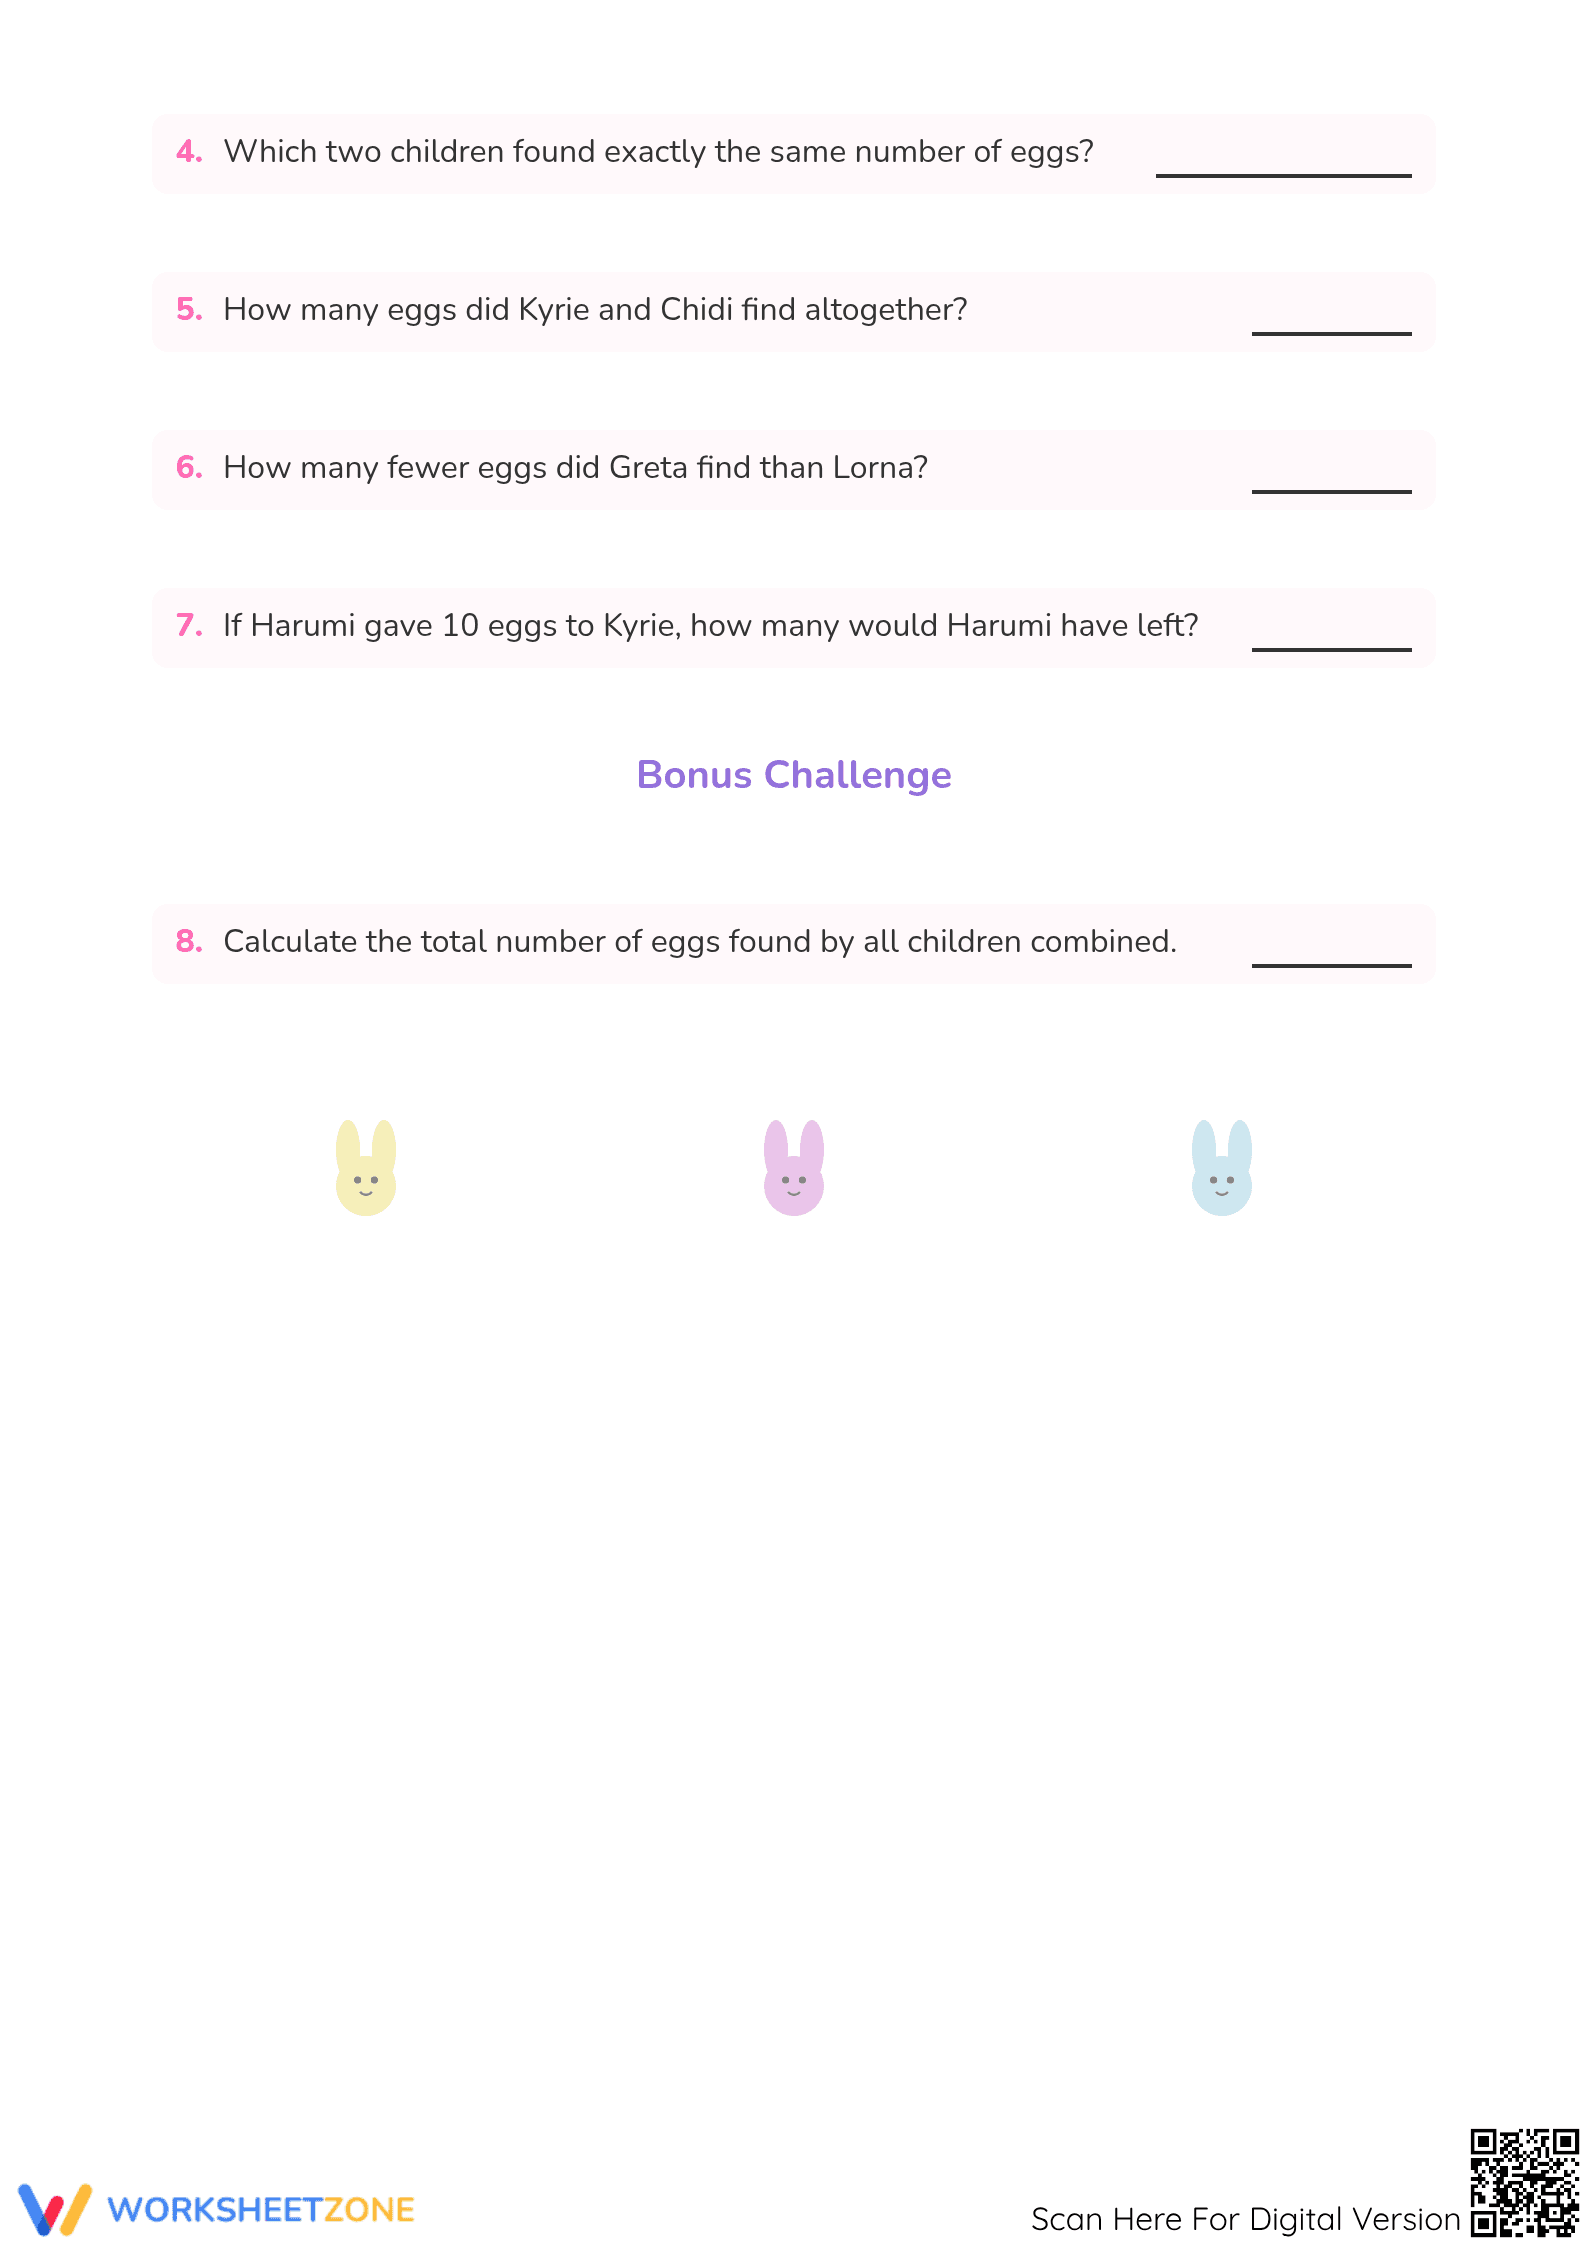
- Independent Practice: The advanced section introduces multi-step word problems involving hypothetical transfers of items and a final summative task requiring the addition of all data points across eight different categories.
This gradual-release structure ensures that students build confidence with the scale before tackling the higher-order thinking demands of the bonus challenge.
Standards Alignment
This worksheet is aligned to CCSS.MATH.CONTENT.3.MD.B.3: "Solve one- and two-step 'how many more' and 'how many less' problems using information presented in scaled picture graphs." It specifically targets the picture graph component of the measurement and data domain. Both standard codes can be copied directly into lesson plans, IEP goals, or district curriculum mapping tools.
How to Use It
This worksheet is ideal for a mid-unit formative assessment during your data and graphing module. Use it after direct instruction on scaled graphs to verify that students can accurately apply a key to determine values. During the activity, observe if students are using repeated addition or multiplication to solve for totals. Expected completion time is 25 minutes.
Who It's For
This resource is designed for Grade 3 general education students but serves as an excellent extension for high-achieving second graders. It pairs naturally with a math center rotation or as a standalone holiday activity to maintain instructional rigor during seasonal transitions. It works well for small groups or individual homework assignments.
Data interpretation is a foundational pillar of mathematical literacy, as emphasized in the CCSS.MATH.CONTENT.3.MD.B.3 framework. According to EdReports 2024, high-quality math materials must provide explicit opportunities for students to engage with "how many more" and "how many fewer" problems in varied contexts. This worksheet meets that demand by utilizing a scaled pictograph (1:5 ratio) to bridge the gap between basic counting and proportional reasoning. Fisher & Frey (2014) highlight the importance of gradual release in math instruction, a principle reflected in the progression from simple retrieval to the multi-step "Bonus Challenge" included here. By requiring students to synthesize data across eight distinct categories, the resource promotes the rigorous application of data analysis skills necessary for later success in statistics and probability. This targeted practice ensures students can fluently transition between visual representations and numerical values in real-world scenarios.