What It Is:
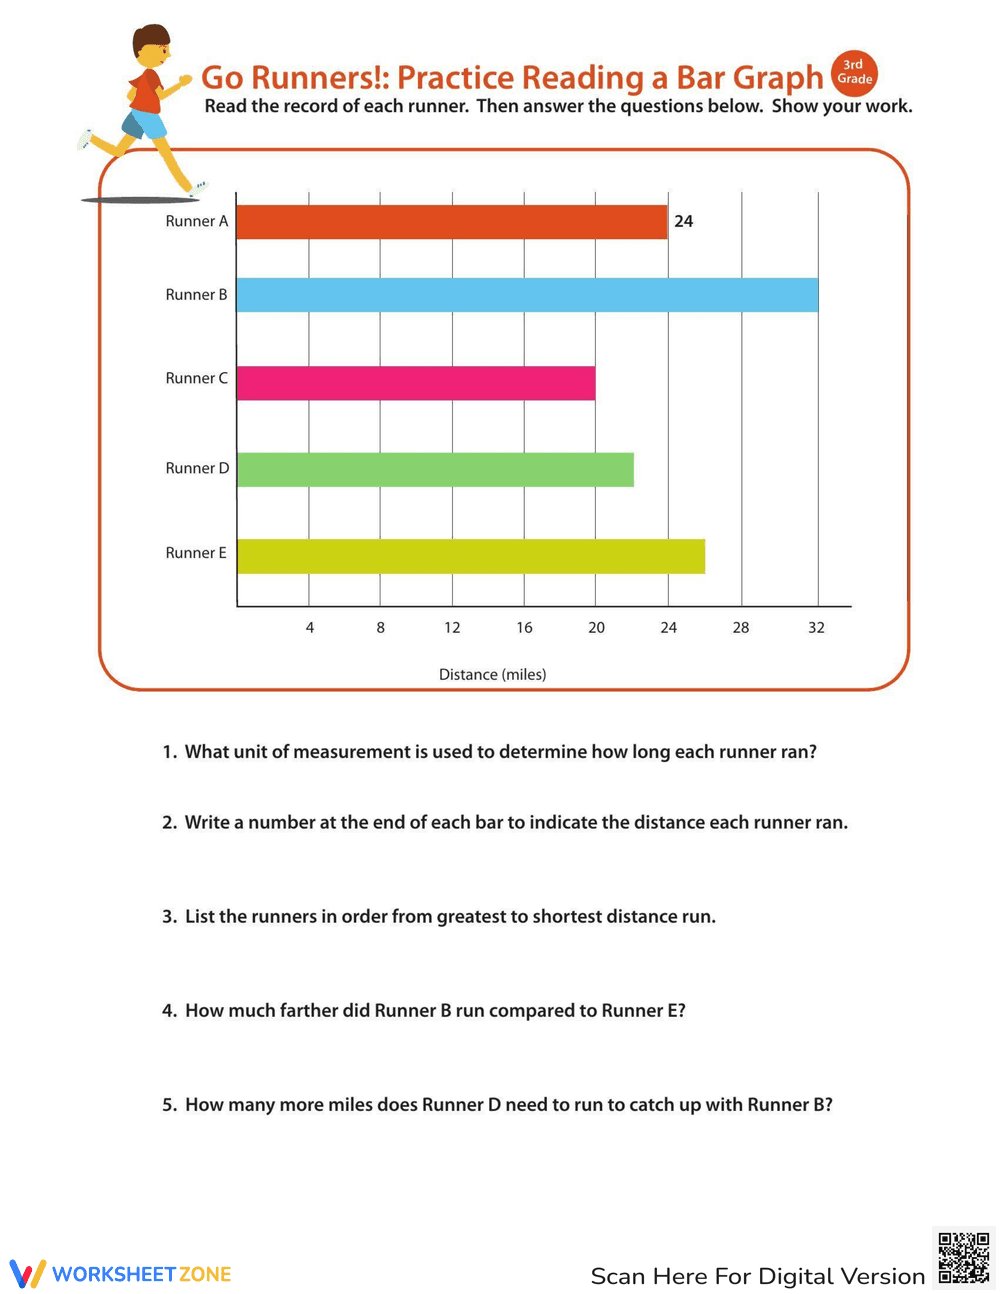
This is a worksheet designed to help students practice reading and interpreting a bar graph. The bar graph shows the distance (in miles) run by five different runners: Runner A, Runner B, Runner C, Runner D, and Runner E. The worksheet includes five questions that require students to analyze the data presented in the graph, such as identifying the unit of measurement, ordering the runners by distance, and calculating the difference in distances between runners. One distance is already labeled (Runner A at 24 miles).
Grade Level Suitability:
This worksheet appears suitable for 3rd grade. The bar graph is relatively simple, and the questions require basic data analysis skills, such as comparing and ordering numbers, and simple subtraction, which are typically taught in 3rd grade.
Why Use It:
This worksheet reinforces the skill of reading and interpreting bar graphs, a fundamental concept in data analysis. It helps students develop critical thinking skills by requiring them to extract information from the graph and apply it to answer specific questions. It also provides practice in comparing quantities and performing simple calculations based on the data.
How to Use It:
First, have students carefully examine the bar graph, paying attention to the labels on the axes and the scale. Next, instruct them to write the distance for each runner at the end of each bar. Then, guide them to answer the questions provided, using the information from the bar graph to support their answers. Encourage students to show their work for calculations.
Target Users:
This worksheet is designed for elementary school students, specifically those in the 3rd grade, who are learning about bar graphs and data analysis. It can be used in a classroom setting, as a homework assignment, or for individual practice.