


0
Views
0
Downloads
0.0
0
Save
0 Likes
Favorite BBQ Food Bar Graph: Data Interpretation Practice
0 Views
0 Downloads
Paste this activity's link or code into your existing LMS (Google Classroom, Canvas, Teams, Schoology, Moodle, etc.).
Students can open and work on the activity right away, with no student login required.
You'll still be able to track student progress and results from your teacher account.
Information
Description
What It Is:
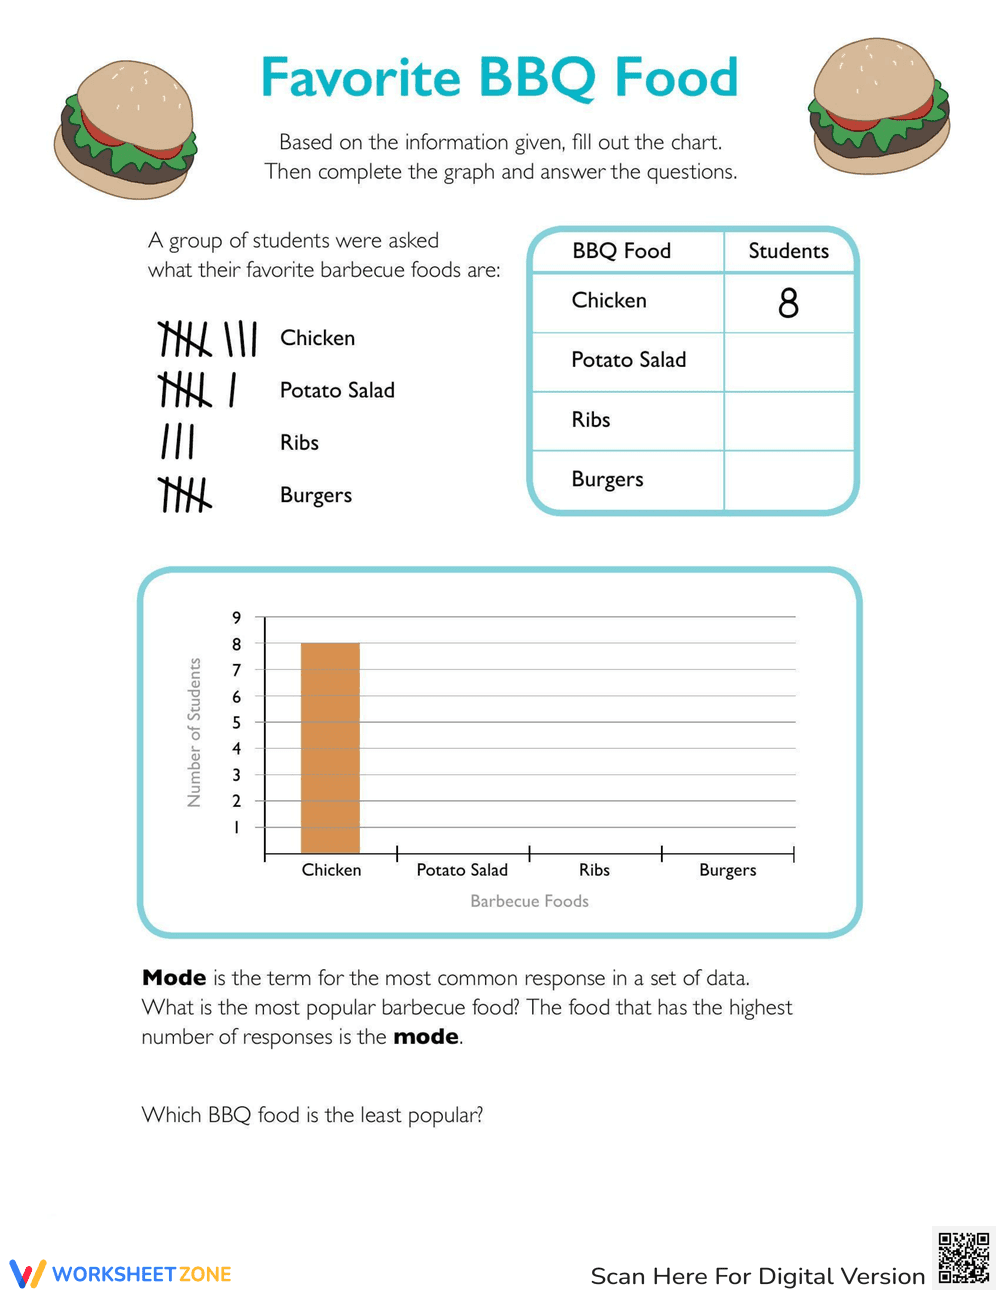
This worksheet focuses on data interpretation and graphing skills using the theme of favorite BBQ foods. Students are provided with tally marks representing student preferences for Chicken, Potato Salad, Ribs, and Burgers. They must use this data to complete a table and then create a bar graph. Finally, they answer questions about the mode and least popular BBQ food.
Grade Level Suitability:
This worksheet is suitable for grades 2-4. It involves basic data collection, table completion, and bar graph creation, which are typically introduced in these grade levels. The questions are straightforward and require simple analysis of the data.
Why Use It:
It helps students practice data analysis, tallying, creating graphs, and interpreting data to answer questions. It also introduces the concept of 'mode' in a simple, relatable context. The BBQ theme makes it engaging for students.
How to Use It:
First, have students count the tally marks for each BBQ food and fill in the 'Students' column of the table. Then, guide them in creating a bar graph based on the data in the table. Finally, help them answer the questions about the mode and least popular food, using the completed graph and table.
Target Users:
This worksheet is designed for elementary school students learning about data representation and analysis, particularly those in grades 2-4. It is also helpful for students who need extra practice with graphing and interpreting data.