


Views
Downloads
Grade 2 Graphing — Printable No-Prep Worksheet
Paste this activity's link or code into your existing LMS (Google Classroom, Canvas, Teams, Schoology, Moodle, etc.).
Students can open and work on the activity right away, with no student login required.
You'll still be able to track student progress and results from your teacher account.
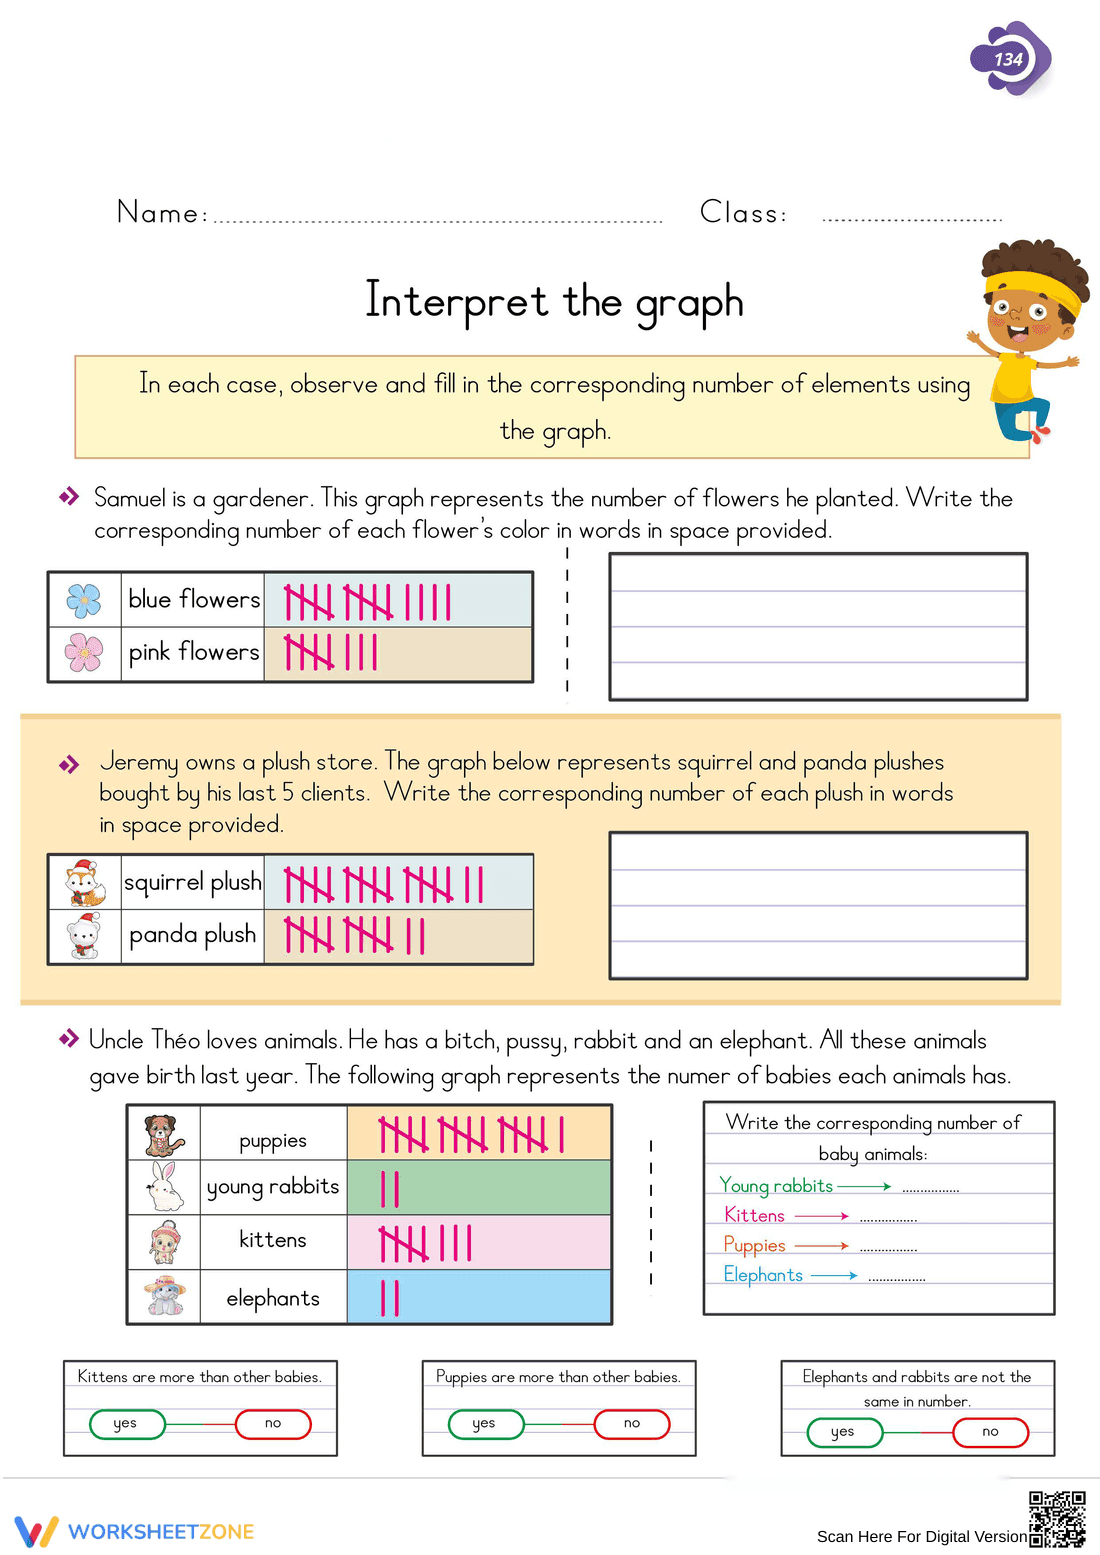
This Grade 2 math worksheet helps students master interpreting data from tally charts. Learners read three scenarios, count the tallies for each category, and use the data to answer comparison questions. It's a focused tool for building foundational data analysis skills.
At a Glance
- Grade: 2 · Subject: Math (Graphing)
- Standard:
CCSS.MATH.CONTENT.2.MD.D.10— Represent and interpret data using tally charts and bar graphs.- Skill Focus: Interpreting Tally Charts
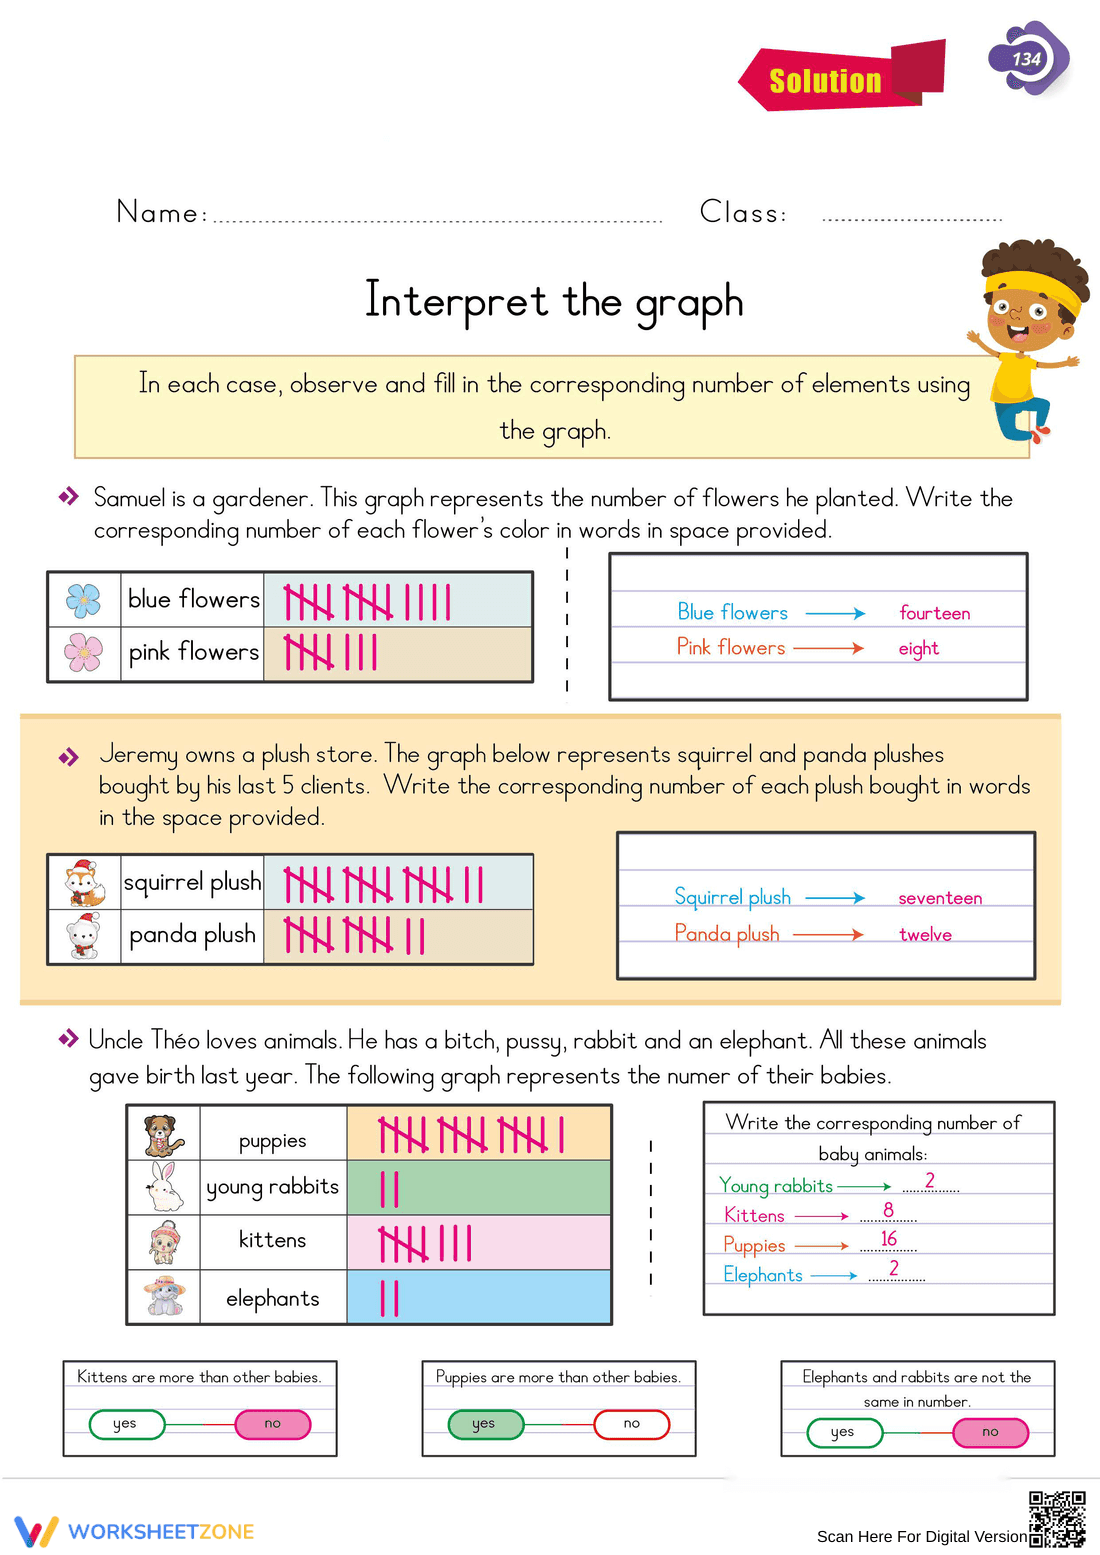
- Format: 2 pages · 9 problems · Answer key included · PDF
- Best For: Independent practice, station work, or homework
- Time: 10–15 minutes
What's Inside
This two-page PDF contains a single-page worksheet and a full answer key. The worksheet presents three data problems where students interpret tally charts. Tasks include writing numbers as words and numerals and answering simple yes/no comparison questions, providing a well-rounded practice session on foundational data skills.
A Proven Zero-Prep Workflow
Designed for the busy classroom, this resource is a true print-and-go activity ready in under two minutes.
- Print (30 seconds): The worksheet is a single page with a corresponding answer key.
- Distribute (60 seconds): Clear instructions let students begin work immediately with minimal direction.
- Review (5 minutes): Use the provided key for quick grading or student self-checking.
Its simple design makes it an ideal resource for a sub plan or independent work.
Standards-Aligned for Grade 2
This worksheet directly supports a key Common Core math standard:
CCSS.MATH.CONTENT.2.MD.D.10: Represent and interpret data, including solving compare problems using information from a bar graph.
This activity builds the foundational data-reading skills necessary for mastering the standard. The code can be copied directly into lesson plans, IEPs, or curriculum maps.
How to Use This Worksheet
Use this resource for independent practice after a lesson on tally charts. Students typically complete it in 10-15 minutes. For a formative assessment, circulate as students work, observing how they count the tally bundles and compare the totals. It also works well in a collaborative math station to encourage peer discussion.
Who It's For
This worksheet is designed for second-grade students learning about data. The clear layout also benefits first graders ready for a challenge or third graders needing reinforcement. Pair this worksheet with an anchor chart showing how to count tally marks to support all learners in your classroom.
This worksheet provides targeted practice on interpreting data, a critical component of elementary mathematics education aligned with CCSS.MATH.CONTENT.2.MD.D.10. By having students translate tally marks into quantities and then compare those quantities, it builds foundational data literacy. Research consistently shows that structured practice with data representation is essential. For instance, the RAND AIRS 2024 report emphasizes that early and repeated exposure to data organization, like tally charts, is a key predictor of later success in statistics and probability. This resource offers that precise, structured practice, moving students from simple counting to comparative analysis in a single, efficient activity. It serves as an effective tool for teachers to assess student understanding of one-to-one correspondence and basic data interpretation, skills that are fundamental to mathematical reasoning and problem-solving across all grade levels.