10th Grade Electromagnetic Spectrum Worksheets
These electromagnetic spectrum printable worksheets for 10th grade cover the full instructional arc of an EM radiation unit — from ordering the seven spectral regions by wavelength and frequency to solving photon energy problems using E = hf. The set includes diagram-labeling exercises, properties comparison charts, wave equation practice, real-world applications matching, and formative assessment quizzes, sequenced to carry students from visual recognition toward quantitative problem-solving without skipping the conceptual groundwork.
What's Inside the Set
Each worksheet in this collection of electromagnetic spectrum printable worksheets for 10th grade targets a distinct stage of understanding. The formats include:
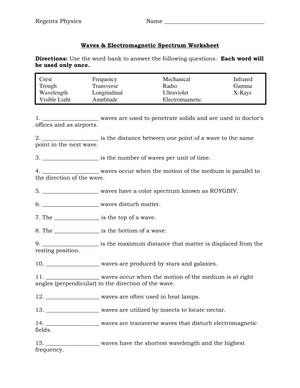
- Diagram-labeling exercises — students annotate blank wave graphics, marking crests, troughs, and the relative compression of wavelengths from radio waves through gamma rays
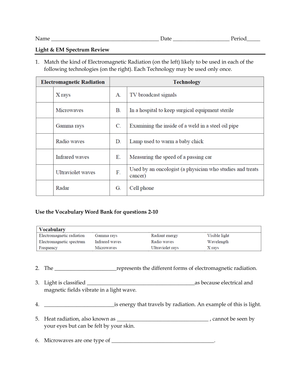
- Properties comparison charts — fill-in tables matching each spectral region to wavelength range, frequency range, and real-world applications
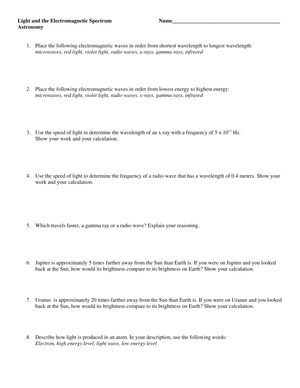
- Wave equation practice — scenario-based word problems using c = fλ and E = hf, requiring unit conversion and algebraic manipulation
- Real-world applications matching — students connect each region to specific technologies and justify the connection using energy and frequency data
- Formative assessment quizzes — short true/false and multiple-choice checks designed to run as exit tickets or homework
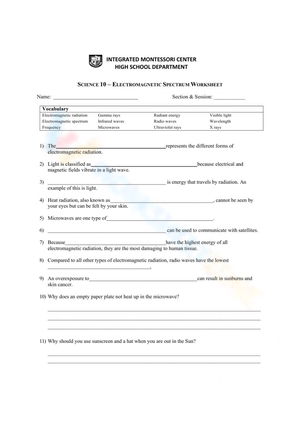
The diagram-labeling exercise surfaces something lectures rarely do: students who can recite the seven regions as a memorized list often cannot connect those names to what waves physically look like at different frequencies. A student who correctly writes "gamma rays have the shortest wavelength" may still sketch a gamma wave that looks identical to a radio wave because the abstract label and the visual representation haven't merged yet.
The comparison charts are where meaningful distinctions emerge. Separating infrared's thermal imaging role from UV's sterilization function requires students to reason about energy levels, not just recall names. The visible light section receives dedicated exercises because students consistently underestimate the energy variation within the 400-to-700-nanometer band — a photon at 400 nm carries roughly twice the energy of one at 700 nm, and that relationship needs repeated handling before it transfers reliably to calculation problems.
Student Errors Worth Catching Before the Unit Exam
Unit conversion generates more lost points in this unit than any conceptual misunderstanding. Students who set up c = fλ correctly will solve for wavelength in meters and report the answer in nanometers without converting — or they'll start with a wavelength given in nanometers, skip the conversion to meters, and arrive at a result off by a factor of 10⁹. In a unit where expected answers span from roughly 10⁻¹² m to 10³ m, a wrong exponent doesn't register as obviously unreasonable the way a negative velocity would in a kinematics problem. Building an explicit unit-check step into the equation worksheets catches this before it becomes a test-day habit.
The inverse relationship between frequency and wavelength is a reliable second trouble spot. Students who can state the relationship correctly revert to additive thinking when a problem changes one variable: given a wave with half the frequency, a meaningful portion of a class will write that wavelength also halves. Having students sketch the wave alongside the calculation — a long, stretched wave for low-frequency radio problems and a tightly compressed one for high-frequency gamma problems — makes the inverse behavior physically visible and reduces this error substantially.
UV and infrared placement causes persistent diagram errors throughout the unit. Students reliably anchor gamma rays at the high-energy end and radio waves at the low-energy end, but the middle of the spectrum stays murky because neither UV nor infrared appears in ROYGBIV. Expect swap errors on labeling worksheets whenever students work without a reference, particularly early in the unit before the comparison chart exercises have reinforced those positions.
Lesson-Planning Strategies for Getting the Most From These Worksheets
The most reliable sequence is to run visual identification work for the first two days before introducing any equations. Day one is diagram labeling and spectrum ordering. Day two is the comparison chart, completed collaboratively so students talk through why each region's applications match its energy level. Delaying the equation worksheets until students can reproduce the spectrum order from memory prevents a common failure mode: students who can solve c = fλ correctly but cannot judge whether their answer is physically reasonable because they have no mental picture of where their wave type sits on the spectrum.
Wave equation worksheets fit best as the first independent practice assignment once that conceptual footing is solid — typically day three or four of the unit. The applications-matching exercise follows naturally after equation practice, since students can now use energy and frequency values to justify their pairings rather than relying on memorized connections. Save the formative quizzes for the final two or three days before the unit assessment. Running one with seven or eight minutes left in class two days out gives teachers specific information — who is still swapping UV and infrared, who is inverting the frequency-wavelength relationship — to address in the next day's review.
The PhET Wave on a String simulation pairs well with the diagram-labeling worksheet on day one, giving students a model they can manipulate before annotating a static diagram. NASA's Tour of the Electromagnetic Spectrum is a reliable companion to the comparison charts — students who work through it alongside the worksheet fill in the application column with more precision than students drawing only from lecture notes.
Standard Alignment
The electromagnetic spectrum printable worksheets for 10th grade in this set address NGSS HS-PS4-1 and HS-PS4-5. HS-PS4-1 requires students to use mathematical representations to support claims about the relationships among frequency, wavelength, and the speed of electromagnetic radiation — exactly what the wave equation exercises practice. HS-PS4-5 asks students to communicate how technological devices apply wave behavior principles to transmit and capture information, which the applications-matching worksheets address directly.
In classroom terms, these standards push past surface labeling. A student who correctly orders the spectrum but cannot explain why X-rays penetrate soft tissue while radio waves do not has met the surface expectation, not the performance expectation. The set's progression — visual identification, then quantitative calculation, then applications reasoning — is built to close that gap. Teachers in NGSS-aligned states will find the wave properties component of the HS-PS4 bundle covered without supplemental materials.
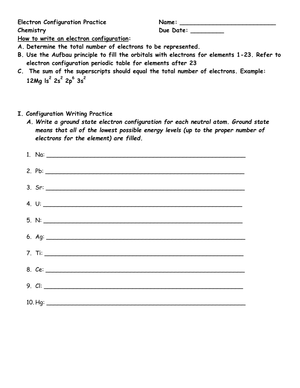
The E = hf worksheets carry additional value in states where the photoelectric effect and atomic emission spectra appear in the 10th or 11th grade chemistry sequence. Teachers running an integrated course or preparing students for AP Physics find those exercises transfer directly into the quantum unit without modification.
Differentiating These Worksheets for a Range of Learners
Students who need additional support benefit from a printed spectrum reference strip used alongside the equation worksheets — a labeled diagram of all seven regions with wavelength ranges noted. The strip removes the memory retrieval demand so students can direct their full attention to the algebraic manipulation. This separates two cognitive tasks that frequently collapse on each other for students who haven't yet internalized the spectrum order.
Students working above grade level can extend the comparison chart by calculating photon energy at the midpoint wavelength of each spectral region, ranking all seven, and writing a brief explanation of why the top three regions qualify as ionizing radiation. That extension converts a fill-in task into a quantitative reasoning exercise and builds toward the written justification format expected on AP Physics free-response questions.
For electromagnetic spectrum printable worksheets for 10th grade deployed across mixed-ability classrooms, the comparison chart is the most adaptable format in the set. Removing the application column reduces the cognitive demand for students still building confidence; adding an energy ratio column raises it for those ready for more. Both groups work the same structure with different requirements, which keeps whole-class discussion viable and eliminates the overhead of managing entirely separate handouts.
Frequently Asked Questions
What equations do students need to solve the wave math problems?
Two equations drive the quantitative work throughout the set: c = fλ, where c is the speed of light (3 × 10⁸ m/s), f is frequency in hertz, and λ is wavelength in meters; and E = hf, where E is photon energy in joules and h is Planck's constant (6.626 × 10⁻³⁴ J·s). Most problems supply two of the three variables and ask students to solve for the third. Students who are still uncertain about scientific notation will find the unit conversion requirements genuinely disruptive, independent of whether they understand the physics — a brief review of exponent arithmetic at the start of the unit pays dividends throughout.
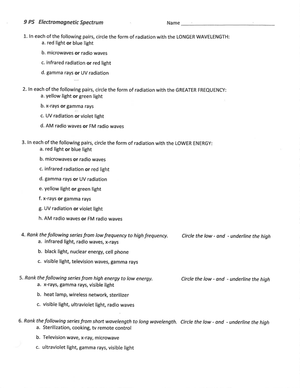
What is the correct order of the spectrum from lowest to highest energy?
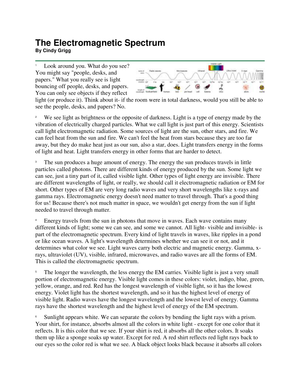
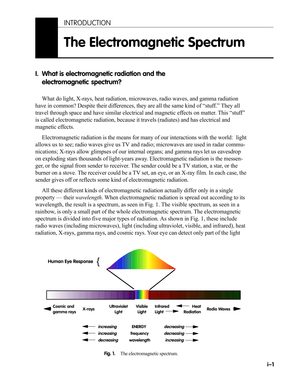
Radio waves, microwaves, infrared, visible light, ultraviolet, X-rays, and gamma rays — listed from lowest energy, longest wavelength, and lowest frequency to highest. Gamma rays carry the most energy and the shortest wavelength. Within the visible band alone, violet light at roughly 400 nm carries about twice the energy of red light at 700 nm — a fact students find genuinely surprising and that appears regularly in assessment questions.
Which worksheets work best as homework versus in-class assignments?
Diagram-labeling and comparison chart worksheets are better used in class, where misconceptions surface in real time and can be corrected before they calcify. Students who swap UV and infrared or reverse the energy-wavelength relationship on homework will often reproduce those errors on the assessment if no one catches it first. Wave equation worksheets work well as homework once students have practiced the algebra in a guided class setting. The formative quizzes are flexible — they function as exit tickets, warm-up reviews, or brief homework checks depending on where the unit stands.
How do the real-world applications exercises connect to student experience?
The applications-matching exercises anchor to technologies students encounter regularly — Wi-Fi operating in the microwave range, UV blocking in sunscreen, infrared sensors in automatic doors, X-ray imaging in medical settings. Students first match each region to its application, then use frequency and energy data to explain the connection in writing. That second step is where passive recognition becomes active reasoning, and it transfers directly to open-ended questions on standardized physics assessments.
Clear All